Low PE Stock YTD Performance (F, VIAB, & M)
Index - https://steemit.com/tax/@alhofmeister/4njxqk-accounting-and-finance-blog-index
Introduction
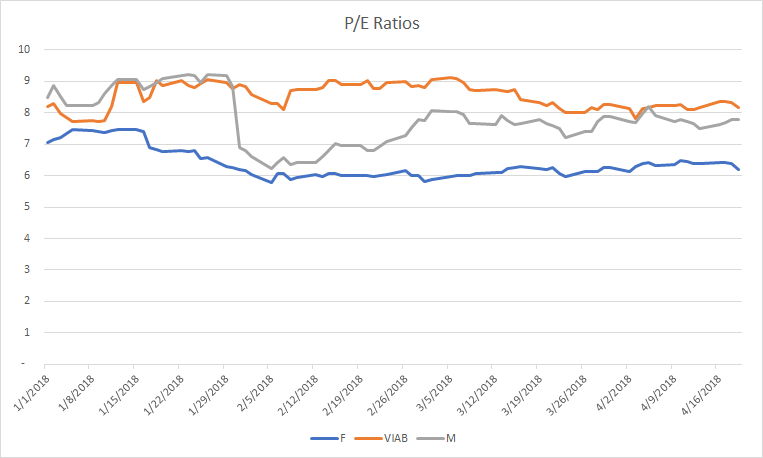
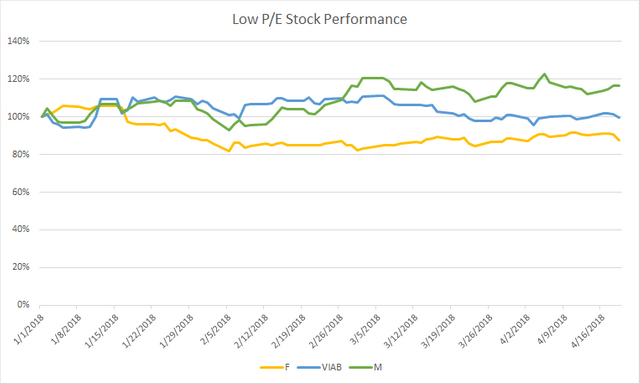
In this post, I wanted to present two graphs. The first graph shows the price to earnings ratio for companies that have low P/E ratios. The second graph shows the year to date performance of each of the 3 companies (current market cap / market cap as of January 1). As demonstrated by the second graph, Ford has performed fairly well since the beginning of the year whereas Viacom and Macy's has a loss in value.
P/E Ratio
YTD Performance
References
https://www.zacks.com/stock/chart/F/fundamental/market-cap
https://www.zacks.com/stock/chart/VIAB/fundamental/market-cap
https://www.zacks.com/stock/chart/M/fundamental/market-cap
https://www.zacks.com/stock/chart/F/fundamental/pe-ratio-ttm
https://www.zacks.com/stock/chart/VIAB/fundamental/pe-ratio-ttm
https://www.zacks.com/stock/chart/M/fundamental/pe-ratio-ttm
@contentvoter
@OriginalWorks
Your self votes will be countered by @sadkitten for 1 week starting Sunday, April 29th 2018, 6:59 because your account is one of the highest self voters. For more details see this post.
Good post. Really informative