Online Free Charting Software for any stock market. It is one of the best free Charting Software available.
Lets Talk about free Online Technical Charting Software.
First of all, for those who say that nothing comes for free, this statement is not right either.
Today I will tell you about a technical analysis charting platform that is completely free for all, whether you are a small investor or a big investor, this platform is very important for you. Because in this you can perform everything which is available in a professional charting software.
In addition you can also analyze the fundamental terms of any script you want. Is it not a bonus?
Before we get started lets know why this technical analysis charting platform is free for everyone? and how it provides all professional facilities for free?
Its simple. the Technical analysis charting platform and fundamental information providing platform I am going to tell is an online website where you can perform both of the things, as it is an online website its main source of income is advertisements.
Yes they server advertises on their platform But don't worry, they don't serve much. In addition you can purchase their membership also which is ad-free I will explain this term below.
Now lets get started. To learn about Free technical analysis charting software for new traders or students.
The website is Investing.com

Lets Know Something about it.
Investing is a financial markets platform providing real-time data, quotes, charts, financial tools, breaking news and analysis across 250 exchanges around the world in 44 language editions. With more than 21 million monthly users, and over 180 million sessions, Investing.com is one of the top three global financial websites according to both SimilarWeb and Alexa.
With over 300,000 financial instruments covered, Investing offers unlimited access to cutting-edge financial market tools such as real-time quotes & alerts, customised portfolios, personal alerts, calendars, calculators, and financial insights, completely free of charge.
In addition to the global Stock Markets, Investing also covers Commodities, Cryptocurrencies, World Indices, World Currencies, Commodities, Bonds, Funds & Interest Rates, ETF's Futures and Options.
Investing strives to be a one-stop-shop for traders and investors with apps available on iOS and Android, which has been the highest rated financial markets app on Google Play for five consecutive years.
Now Lets know how to get started with this best online technical analysis charting platform in India.
Simply open your best browser and Follow this URL Investing.com
Indian Version Look Of Platform.
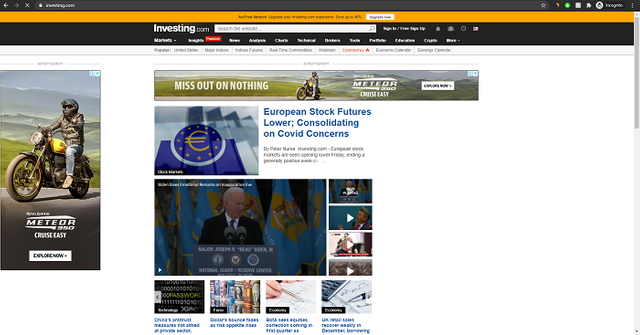
Now, we will have a look at how can we use Investing’s Online Technical Analysis Charting Software. Follow this step by step guide to use their online charting software.
- Create your account with Investing
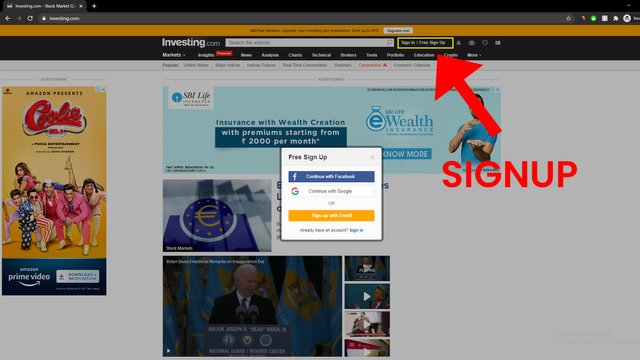
Simply Just Click Sign In / Free Sign Up button, A popup will appear same as shown in image given above.
You have to select the mode whichever you want to sign up with. Google / Facebook / Email ID. Once you signed up, now you have almost all the benefits of an online technical analysis charting platform.
- For daily routine you can create a portfolio where you can save all the script of your choice & technical charts patterns data so that you do not need to search scripts again and again & apply patterns again and again you want daily.
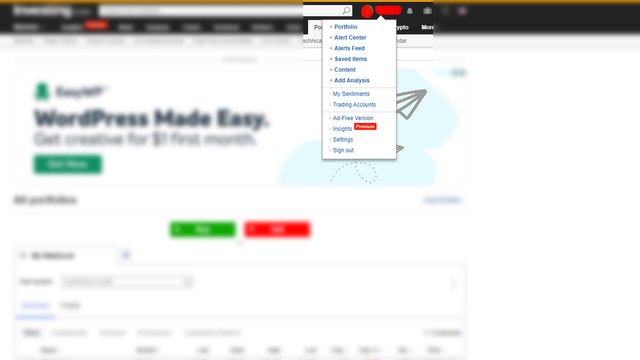
Now I will explain you all the features of Portfolio.
- You can create Tow Types of portfolio like given below.
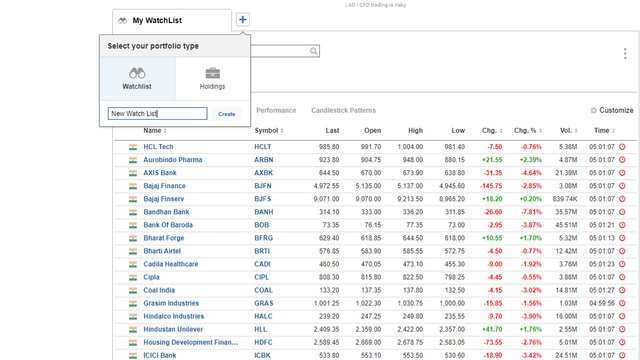
Watch List : You can create a portfolio in watchlist section for those scripts on which you are regularly keeping your eyes on.
Holdings : You can create a portfolio in holding section where you can manage and see your holding scripts.
Both these options are given for your convenience. also you can rename those and create multiples watchlist as much as you want.
- Adding Scripts in your watchlist
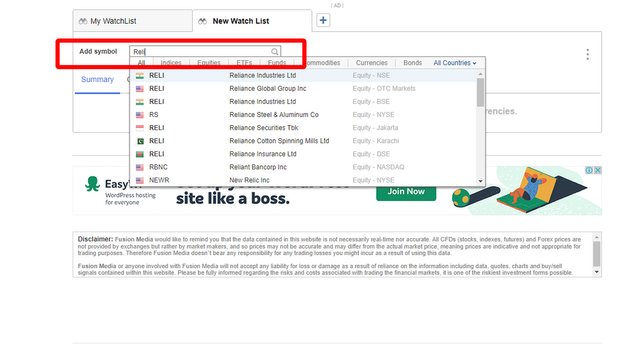
Just type the script name you want to add in your watch list in this section. For your convenience they provide some filters above list of symbols.
- Portfolio main highlights
There are tow section,
Summary. Where you get summarized Information about SCRIPT.
Chart. It displays technical Chart for scripts.
Section 1) Summary
In this section there are various types of summarized information which are listed below.
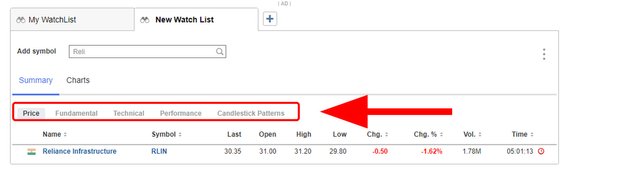
A) Price
In this section, you can get todays information about price of selected script / Symbol.
You get information about Name, Symbol Short name, Last, Open, High, Low, Change, Change in %, Total Volume.
B) Fundamental
In this section you can get live information about fundamental aspects of symbol.
C) Technical
In this section they shows what technical analysis of chart suggests. Also you can adjust time value from the given settings (customization) icon.
D) Performance
In this section they show performance history of selected symbol. Like what performance did this script in past 1 week or 1 years.
E) Candlestick Pattern
In this section you will get to know what pattern of candlestick (a term of Technical analysis charting) is forming.
Section 2) Charts
Now here I will explain about charts in details. So Refer to below Main image for sequenced information.
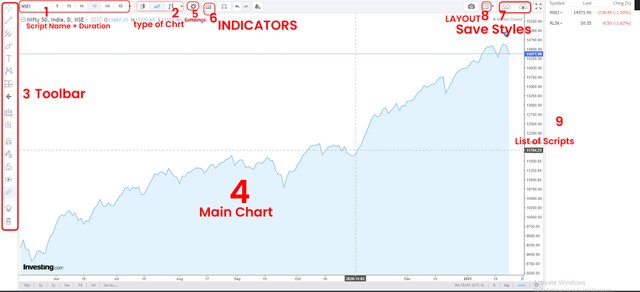
- Script Name + Duration
Here you can select or search script or symbol name whatever you want. Once you selected your choice of your script you can select time duration in which you want to analyze the script.
- Type Of Chart.
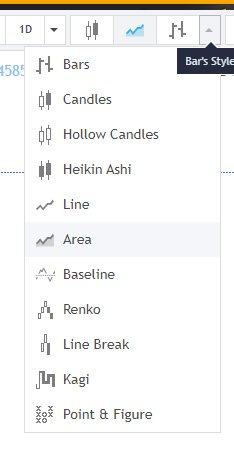
From these button you can change between the pattern of chart you want to see. Like if you want to analyze the chart in candlestick so you can select that. Below image shows the multiple patterns which are available to use.
- Toolbar
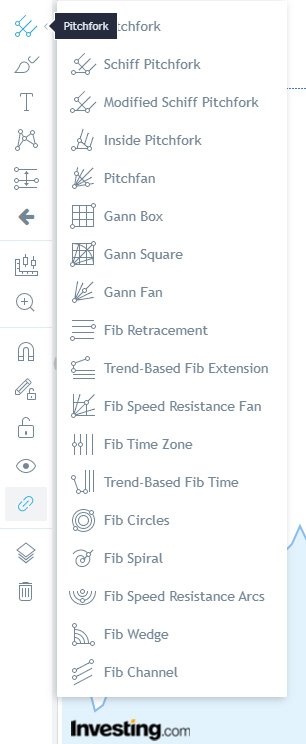
In this toolbar section you can find multiple options or we can say tool option which are mostly used for analyzing the technical chart. It can be simple Trend Line, Or Parallel Line or Trend angle and much more. Also I have attached an image of some advanced tools which are used in Technical analysis of stock market script.
- Main Chart.
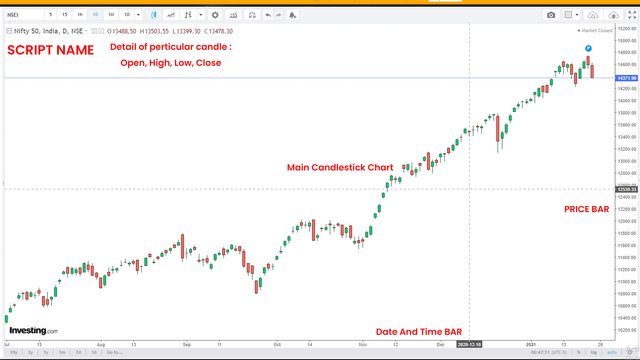
Simply In this whole section the main chart is displayed. In the below image I have highlighted main some parts with their name respectively.
- Settings / Styles.
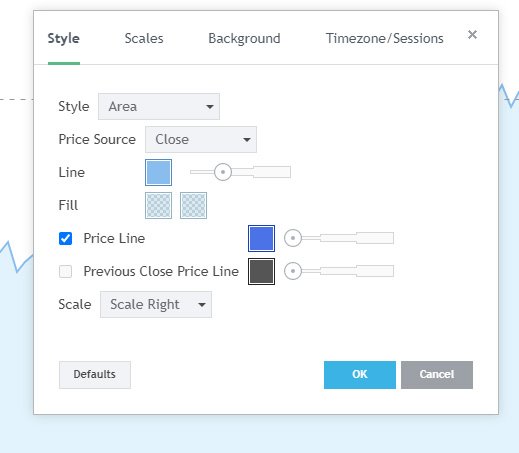
from this section you can change the settings of technical chart, you can change the way you want to see it. Also from here you can handle setting of a pattern like the color you want to set on a line or any thing.
- Indicators
By clicking this button, You can discover all amazing Indicators. Just click on any indicator and it will get applied on you technical Chart. Here is the list of all 78 technical indicators you get from this online technical analysis charting platform.
1 Accumulation/Distribution
2 Accumulative Swing Index
3 Advance/Decline
4 Arnaud Legoux Moving Average
5 Aroon
6 Average Directional Index
7 Average True Range
8 Awesome Oscillator
9 Balance of Power
10 Bollinger Bands
11 Bollinger Bands %B
12 Bollinger Bands Width
13 Chaikin Money Flow
14 Chaikin Oscillator
15 Chande Kroll Stop
16 Chande Momentum Oscillator
17 Chop Zone
18 Choppiness Index
19 Commodity Channel Index
20 Connors RSI
21 Coppock Curve
22 Correlation Coefficient
23 Detrended Price Oscillator
24 Directional Movement
25 Donchian Channels
26 Double EMA
27 Ease Of Movement
28 Elder's Force Index
29 EMA Cross
30 Envelope
31 Fisher Transform
32 Historical Volatility
33 Hull Moving Average
34 Ichimoku Cloud
35 Keltner Channels
36 Klinger Oscillator
37 Know Sure Thing
38 Least Squares Moving Average
39 Linear Regression Curve
40 MA Cross
41 MA with EMA Cross
42 Mass Index
43 McGinley Dynamic
44 Momentum
45 Money Flow
46 Moving Average
47 Moving Average Channel
48 MACD
49 Moving Average Exponential
50 Moving Average Weighted
51 Net Volume
52 On Balance Volume
53 Parabolic SAR
54 Price Channel
55 Price Oscillator
56 Price Volume Trend
57 Rate Of Change
58 Relative Strength Index
59 Relative Vigor Index
60 Relative Volatility Index
61 SMI Ergodic Indicator/Oscillator
62 Smoothed Moving Average
63 Stochastic
64 Stochastic RSI
65 TRIX
66 Triple EMA
67 True Strength Indicator
68 Ultimate Oscillator
69 VWAP
70 VWMA
71 Volume Oscillator
72 Vortex Indicator
73 Williams %R
74 Williams Alligator
75 Williams Fractal
76 Volume
77 Zig Zag
78 SuperTrend
If you want to learn all technical indicator and their uses, refer to the information given at bottom.
- Save & Load Chart.
In this section you can upload or save your preferred multiple styles of chart layout with customized names. Once you applied all your technical pattern to your chart then click on upload cloud Icon and give a name of your choice and woohya!! Layout saved. Now anytime you can Load your layout.
- Layouts.
In this section you can select between multiple layout types like you want 1 screen or 2 or 3.
- List Of Scripts.
Here you can see all those list of your scripts / Symbols which you have been added in the portfolio creating.
That's All my Folks for this wonderful free online technical analysis charting software or you can say a platform.
Conclusion
Yes Nothing Comes for free, but watching some ads is not a big deal. This Platform is very useful for students or Small Traders.
Also if you liked this technical analysis charting software you can go for its premium version. In this version you will see whole website without Advertisements.
Thank you for reading this out, Your Support will motivate me to keep posting.
Have a Good Day.