Simulation Results
We do several simulations in our artificial stock market in order to have some
understanding points of what we discover in previous work on statistical properties of
Indonesia stock market (Situngkir & Surya, 2003a, Hariadi & Surya, 2003). A pattern we
want to analyze is the fact of volatility clustering, in which large changes tend to follow
large changes, and small changes tend to follow small changes.
The volatility clustering has been widely known as an important and interesting
property of the financial time-series data. The cause of this property is certainly the
interaction of between the heterogeneous agents; in our case: the fundamentalists, the
chartists, and the noise traders. The decisions of any strategies will be different in the
sense of expectations about future prices. Other important feature of our simulation is
the boundedness of each agents one another on their final decisions; as noted above we
apply the influence strength of any decisions (buy, hold, or sell) as the climate of the
market. Henceforth, in certain time, a climate to sell, hold, or buy among agents becomes
the trigger for the volatility clustering.
In advance, the volatility clustering has understood also impacts to the
distribution of the financial data. The distribution of the price fluctuations (return) is less
Gaussian with fat tails (leptokurtic) fitted with the truncated Levy distribution (Mantegna.
& Stanley, 2000:60-67, Surya, et.al., 2004) i.e.:
⎩
⎨
⎧ = 0
( ) ( ) ,0 L x
p x
ξ α …(6)
where ξ denotes the normalizing constant, l the truncation parameter, and Lα ,0 the
Levy distribution (whose coefficient α and β = 0 ). This is the form of distribution with
finite variance and considering the Central Limit Theorem, which states that the sum of
independent samples from any distribution with finite mean and variance converges to
the Gaussian distribution as the sample size goes to infinity.
Figure 3 shows the distribution of the simulated return compared with the real
data. The distribution of the return is leptokurtic, with fatter tail than Gaussian
distribution
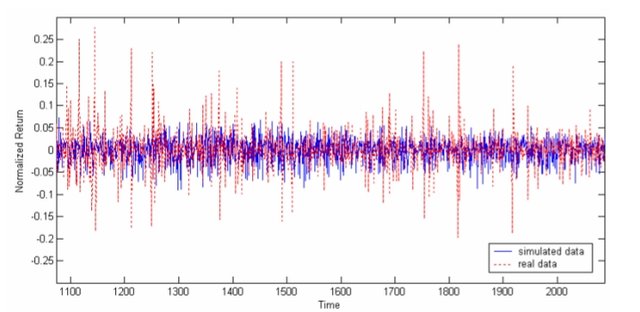
.