Wall Street Secrets Revealed #3 – Timing The Next Stock Market Crash
They say there is statistical proof that a buy-and-hold strategy is a good long-term bet. They say there are academic studies showing that a diversified portfolio of stocks never lost money when bought and held for twenty years or more. They say market timing tends to have a bad reputation and claim it is impossible.
I say buy and hold strategies are so 1960s. I say you can time the market consistently and with great success.
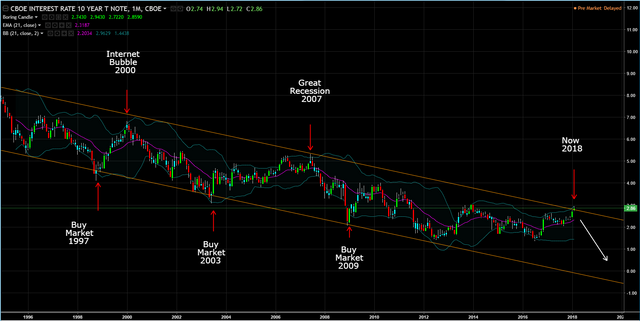
The bond market is almost 2X the stock market. The 10 Year Bond is the highest traded bond by volume. If you just followed the yield of the 10 year bond over the past 15+ years, you could have timed the stock market with 100% accuracy. Below is a monthly chart of the TNX that tracks the yield of the CBOE Interest rate 10 year bond.
Now below is a monthly chart of the SPY, the ETF that follows the S & P 500.
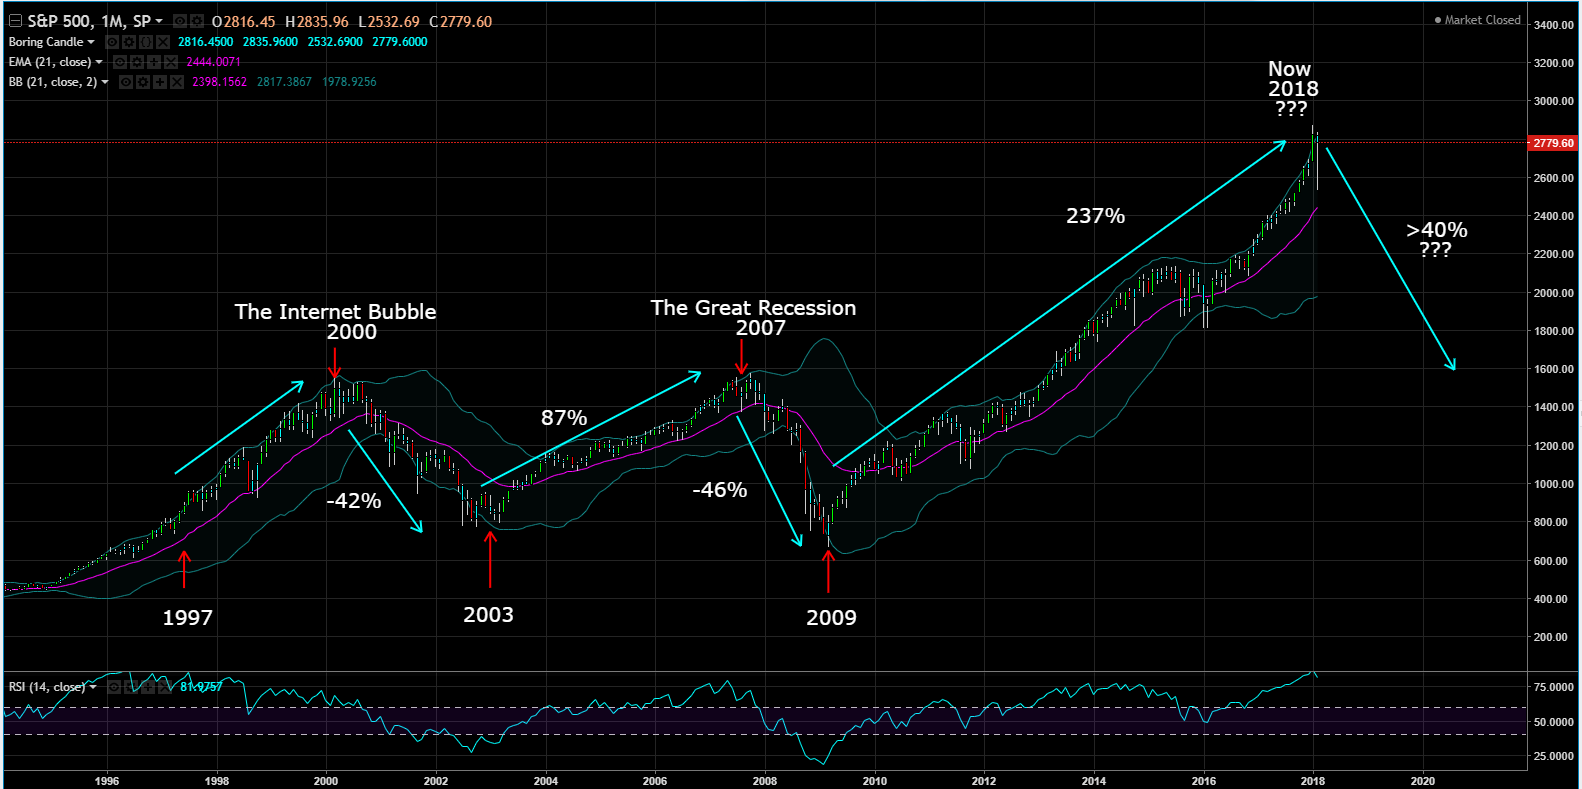
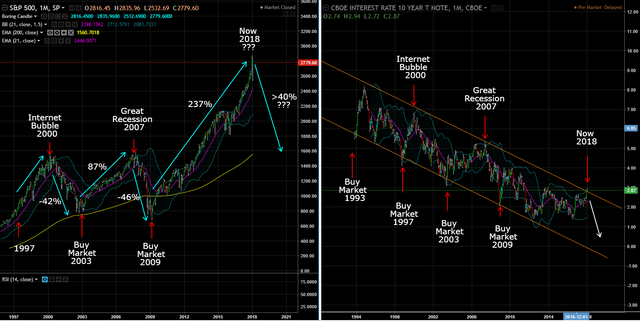
These 2 charts are a direct inverse correlation of each other. The TNX has been trending down in a channel for the last 15+ years. Each time price hit the upper channel, it was time to sell the market. Each time price hit the lower channel line, it was time to buy the market. Each time the price hit the higher channel line, it was time to sell the market.
If you decided to take a buy and hold strategy, $10000 invested in the stock market in 2000 would be worth:
$5300 in 2013
$10846 in 2007
$5857 in 2009
$13881 in 2018
That’s a return of 39%, with all the return coming in the last 5 years. That's an annual return of 2.3%. However, if you factor in an avg. inflation rate of 2.3% over the last 17 years, your return is 0%. If you also had someone else managing your money through a mutual fund with an avg. expense ratio of 1.5%, you now have a negative return on your investment.
If you decided to take a market timing strategy and just following the Big Boys’ footprints (including shorting the market during the decline), $10000 invested in the stock market in 2000 would be worth:
$14200 in 2013
$26554 in 2007
$38769 in 2009
$91882 in 2018
That’s a return of 819%. That’s a whopping 21X over the buy and hold strategy. The biggest difference in the two strategies is the law of numbers. If you have $1.00 and you lost $0.50, you end up with $0.50. But to get back to breakeven, you need a 100% return to get back to $1.00. That why in trading, it’s so important to cut your losses short. Also, you have to do the opposite of what Retail Investors do, they buy high and sell low. You have to mimic what the Big Boys are doing, they buy low from the Retail Investors and sell high to the Retail Investors.
If the charts are any indication of what happens next, based on history you have to be ready to hit the sell button. I anticipate when the market tanks within the next 20-30 months it will crash at least >40%. Because of the tax cuts recently (which makes no sense in an expanding economy), I anticipate the yield going above the upper channel this time. If the yield on the 10 year bond reaches 3.5% - 4.0%, the market may crash sooner than the 20-30 month target. Rest assure I will be here to tell the SteemIt Community when it’s time to sell.
I'm very passionate about helping others preserve and protect capital their capital, so if you have any love ones or friends that might benefit from this post, please feel free to resteem this article or send /email this post. I have personally witnessed many individuals during the 2000 and 2007 bear markets that were about to retire and couldn't, have to work longer or find another job to make end meet.
This post is my personal opinion. I’m not a financial advisor, this isn't financial advise. Do your own research before making investment decisions.
