Stock Market Analysis Report 6-28-18...Where Is The S&P 500 Is Heading Next???
When it comes to the US financial indices, the DOW is heavily weighted toward industrials, the NASDAQ is really represented by 5 stocks, the FANG stocks + Apple and the Russell 2000 represents smaller companies influenced by investor sentiment.
According to Investopedia, a bellwether is an event or indicator that shows the possible presence of a trend. When I want to get the most accurate gauge of the health of the US economy, I turn to the S&P 500.
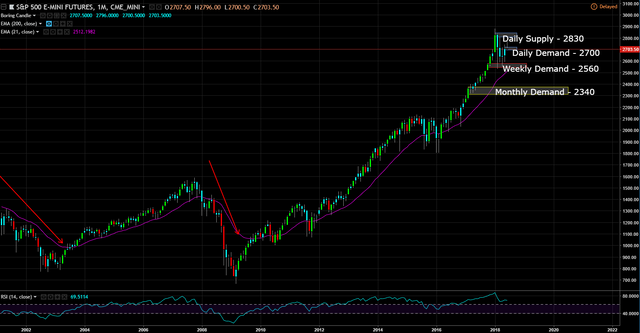
Monthly Chart (Curve) – price is still in a long term uptrend, but in recent months, price has stalled and potential topping out. However, the last time this type of price action happened on a monthly chart was back in the second half of 2015, which eventually resumed the uptrend in 2016.
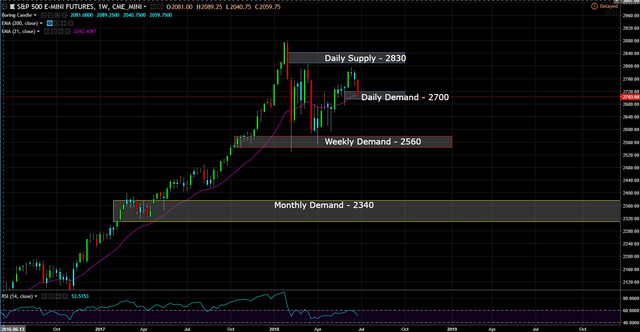
Weekly Chart (Trend) - the trend is sideways and has been range bound since February.
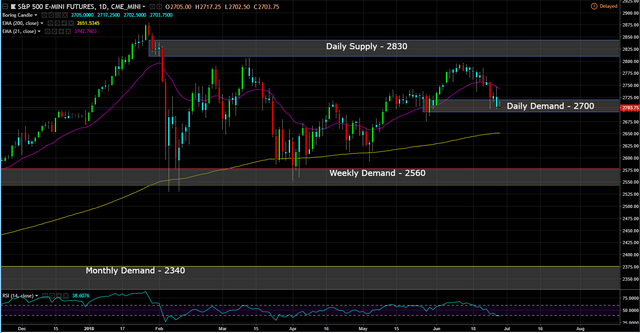
Daily Chart (Entry) – since reaching all-time highs in January, price has attempted twice to take out the daily supply at 2830 in March and mid-June, but both attempts were unsuccessful. Fundamentally, the commencement of trade wars and more anticipated interest rate hikes are going to make it even more difficult for price to get through the daily supply zone and challenge the all-time highs again.
The Markets are design to go up over time. However, if price breaks the daily demand zone at 2700, price will go down and to test the 200 EMA at 2600 (yellow line). The 200 EMA will serve as support, but if that level is breached, look for price to re-test the February lows.
This post is my personal opinion. I’m not a financial advisor, this isn't financial advise. Do your own research before making investment decisions.
