Free Download: Excel File that Uses Yahoo! Historical Price Data to Create Price Charts and Technical Analysis Indicators (e.g. RSI, MACD, StochRSI, ADX, etc.)
What is It:
I named the file Stock Analysis Template, it's an excel spreadsheet that takes up to 256 days worth of price history data (there are approximately 252 stock market trading days per year) from Yahoo! Finance Historical Price data-feed and calculates various technical analysis indicators from it, as well as moving averages, bollinger bands, candlestick charts, and more.
Why Use it?
With so many cheap, or even free, options out there for price charts and TA-indicators, it might seem like a waste of time to use an excel file like this, which requires us to manually collect the data, especially since it currently only allows for 256 days worth of data (this can quickly be tweaked to allow for any number of data entries by "pulling down the calculations", but this obviously takes some effort), when most charting software has over 30 years worth of price data.
So what's the point?
For one, seeing how the analysis indicators (like RSI, ADX, MACD, CCI, StochRSI, CMF, and bollinger bands) are calculated gives us a better grasp of what they're really indicating to us. I'm of the opinion that a trader should never use a tool that they don't fully understand, as doing so puts one in the position of ignorantly misinterpreting what's being indicated and/or over-estimating the signal(s) that's being given by the indicator(s).
Furthermore, going the excel spreadsheet route allows for coding in simple logic commands, or conditional parameters, that will highlight whatever conditions, or patterns, that we're aiming to find, to perhaps make our trading decisions off of. We can, for instance, set up the excel spreadsheet to highlight all prices wherein the "directional moving index" (DMI) has a value below 25, RSI is above 50, and price is trading above the 50 and 20 moving averages. This type of conditional analysis may not appeal to everyone, but it can be useful for traders that like to stick to strict, mathematical rules/ conditions in their trading (the types that create autonomous trading programs to execute their trades).
It also allows us to experiment with making our own TA-indicators or system of finding patterns (e.g. consecutive "green day" and "red day" stats) that may lead to having an edge on the market.
What's Included in the File?
Filling between 252 and 256 rows worth of data from the historical price feed from Yahoo!, copying and pasting all the data that it supplies AFTER using the excel sort command (setting it to sort from earliest to latest dates), will be sufficient to calculate, and create a chart/ table for:
- Simple Moving Averages (SMA) - 5, 10, 20, 50, 100, 200 SMAs
- Relative Strength Index (RSI) - 7 period and 14 period
- Stochastic RSI (Stoch RSI) - 14 period
- Moving Average Convergence/ Divergence (MACD) - 12, 26, 9
- Directional Movement Index (DMI) - 14 period
- Commodity Channel Index (CCI) - 20 period and 100 period
- Chaikin Money Flow (CMF) - 20 period and 40 period
- Strength of Move (SOM) - 5, 10, 20, and 40 periods (this is my own experimental indicator - measures "volume pressure/ momentum", similar to CMF)
- Logical stop-loss prices, based on recent trading history
- 3-month Candlestick Chart
- 6-month Candlestick Chart
- 1-year Candlestick Chart
- Calculation of "Volatility Stops"
- Year High/ Lows Table (highest and lowest volume, highest and lowest closing price, etc.)
You can, of course, modify the tables/ calculations in any way that you wish, adding your own indicators, expanding on the amount of data that can be calculated and charted, deleting the calculations that you don't care for, etc.
What Does it Look Like?
Just to give you a sampling, I provide you with a description of a few, of the many, tabs that make up the excel file, along with a picture that should give you an idea of what to expect.
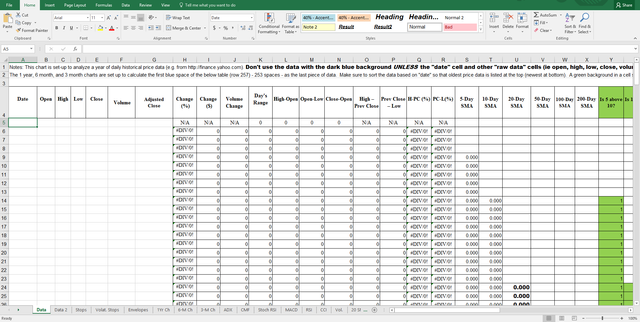
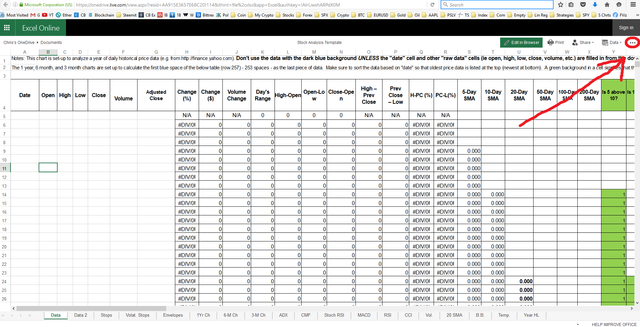
1.) Data
This is where we paste the raw data from Yahoo! historical price feed. All other tables and charts, provided in the other tabs, are calculated out and filled the moment that we paste the data into the correct field.
To the right of the paste area are some simple calculation fields comparing volumes, open, high, low, and closing prices, along with the SMA calculations. Furthest off to the right you'll see green cells. That's the start of some conditional parameters that I added to highlight when the 5 SMA is trading above the 10 SMA. Further to the right are some other SMA conditions that I set the spreadsheet up to highlight.
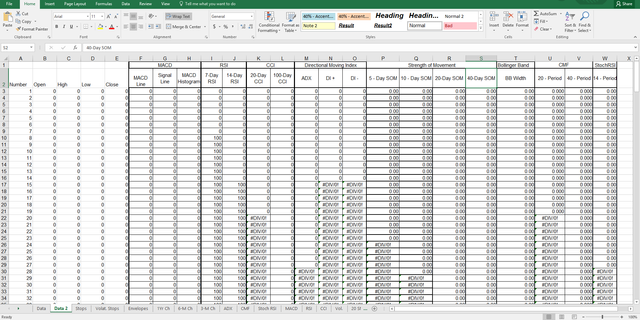
2.) Data 2
As stated above, all these cells are filled as soon as we paste the right amount of data (between 252 and 256 rows) from the historical price feed.
This tab basically lays out all of the technical-analysis indicator's calculations in one table. Each one of these TA indicators has assigned to it it's own tab, which lays out the steps to calculating it, along with some more nuanced analysis into the indicator's signal(s).
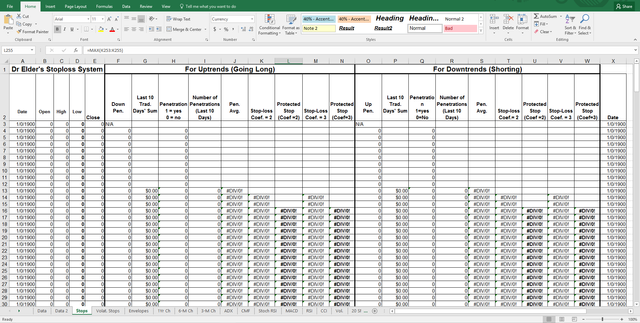
3.) Stops
This uses Dr. Elder's (Come Into my Trading Room) stop system. Without going into too much details about it, it's the protected stop (coefficient 2 and 3) that we're after. All the other cells just go into calculating those important values.
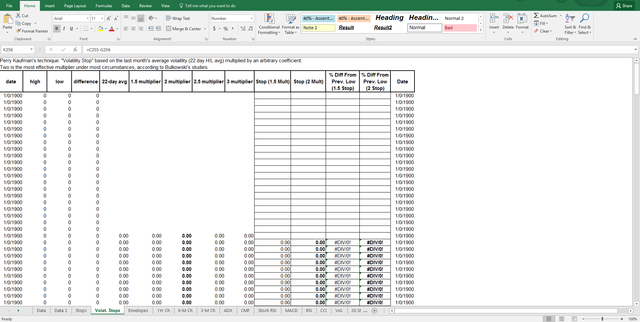
4.) Volatility Stops
This is an alternate stop-loss system to Dr. Elders, used by Perry Kaufman (Smarter Trading: Improving Performance in Changing Markets). It's a bit simpler than Dr. Elder's, using the 22 day average of the difference between the high and low price of each candle (day) and multiplying that average by some coefficient (best to use somewhere between 2 and 3, depending on risk tolerance and the distance to trade target).
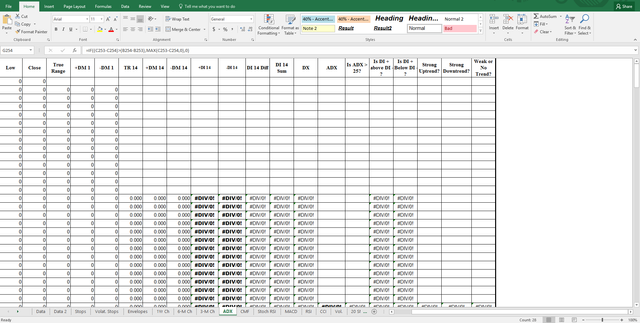
5.) ADX (also DMI)
I provide this as an example of a TA-indicator tab. It goes through all the steps of calculating the final DMI value (should you highlight the cells, you can see exactly how the value in that cell is calculated). To the far right of the table you can see interpretive analysis of the indicator's value coming into play in the columns Strong Uptrend?, Strong Downtrend and Weak or No Trend (these are all conditional cells).
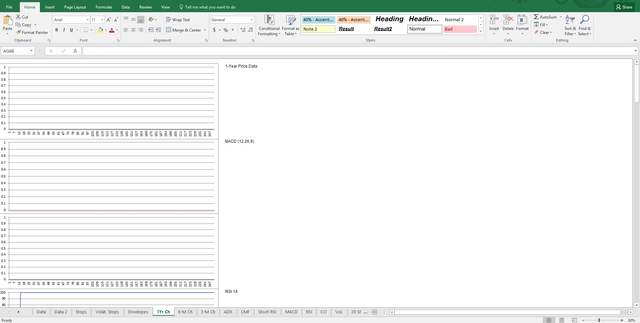
6.) 1-Year Chart
This tab converts the price feed data into a 1-year candlestick chart and the resulting TA-Indicator calculations are also charted (separately from the candlestick chart). Charts are stacked with a 1-year candlestick between each of the indicators. This way we can look at the indicator chart and be able to compare it directly to the price chart, allowing us to spot relationships/ patterns between the two.
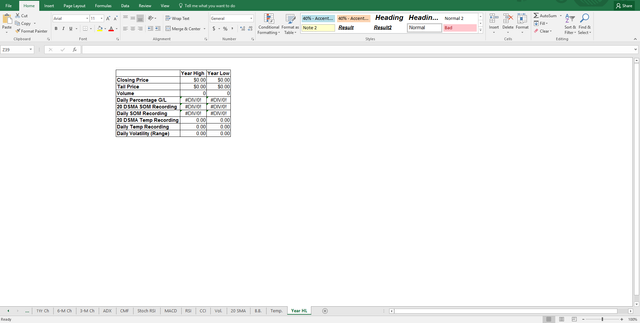
7.) Year H/L
This is a simple table that takes all the data fed into the data page to find the highs and lows within that data range (for volume, price, and more).
That's the Gist of It
There is more to explore, but I've provided the meat of it. If you're interested in it and would like to download it, feel free to follow the simple steps below to make it your own.
How to Safely Download the Stock Analysis Template
1.) Go to the following web address (click on link):
https://1drv.ms/x/s!AiCM5lc2XpGqcorLiwshARPdX0M
This brings you to Microsoft Onedrive, a cloud sharing service that Microsoft provides for Microsoft Office 2013 (and later) users. However, you don't have to use Microsoft Office 2013 (or later) to use or modify this file. Even the freely downloadable and free-to-use knock-off of Microsoft Office, called Open Office (http://www.openoffice.org/), has an excel program that will work fine.
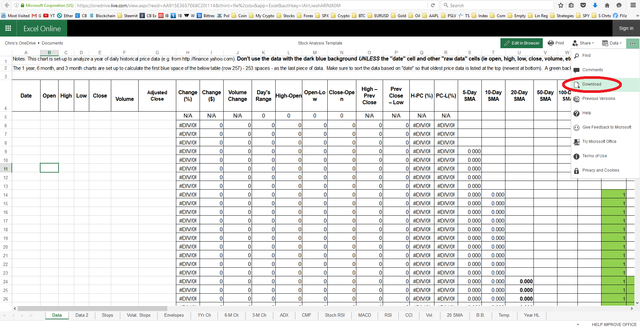
2.) Click on the pull-down menu that provides you with the download option (highlighted in the circle with the arrow pointing to it in the image below):
3.) Click on the download tab from that pull-down menu (circled in the below image):
4.) Be sure to scan the file for viruses before downloading (always the safest/ smartest practice when downloading) and don't forget to save the file to your hard-drive after you've downloaded it.
That's It!
Now it's yours to play around with and change in any way that you wish. You're free to use it and share with others (even for profit!). Most importantly, you may use it as a tool to get a good grasp of how the TA-indicators work - what it is that they're actually showing you. There's also a couple of decent stop-loss systems in here to check out, which might help with your future trades :)
Hi jamesbrown,
Could You send me please your Stock Analysis Template for training ([email protected]) ?
Best Regards,
Mario
Wow man, I like this a lot!! To a n00b like me does this cover crypto currencies or just FIAT?
It works for any "trading instrument" that you can record the high, low, close and volume of, so, yes, it will work for crypto currencies just as well as FIAT, but you'd probably have to get your price data from somewhere other than Yahoo.
Yeah that's the tricky bit. Will try to find a Crypto source! Cheers!
I love the article. Look like download Excel file no more existing. I am getting "This item might not exist or is no longer available". Is it possible to download that file again? Thank you.