My Online Stock Tracker - An Excel Spreadsheet to track your Stocks - Post II
This is the continuation of the post: "My Online Stock Tracker - An Excel Spreadsheet to automatically track your Stocks"
How-To: Track Stocks Investments using Excel. Part II.
Level: Intermediate.
You need: Intermediate Excel skills, Intermediate Stock Investment knowledge.
***** Here is an 'x-ray' of the Excel I use to track my stock investments (Part II) *****
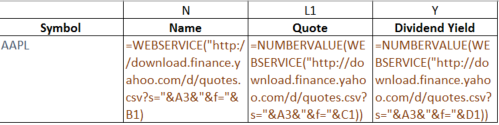
The two important parts of the formula are:
Where it is pulls the ticker symbol from (A3)
The transaction code in Yahoo Finance. In the example above, n = name; l1 is last trade price (lower-case L) and y = dividend yield. More codes below.
To refresh page: press ctrl + F9
Yahoo Finance runs 15 minutes behind the markets.
More Yahoo Finance Transaction Codes below:
Pricing
a: Ask
b: Bid
b2: Ask (Realtime)
b3: Bid (Realtime)
p: Previous Close
o: Open
Dividends
y: Dividend Yield
d: Dividend per Share
r1: Dividend Pay Date
q: Ex-Dividend Date
Date
c1: Change
c: Change & Percent Change
c6: Change (Realtime)
k2: Change Percent (Realtime)
p2: Change in Percent
d1: Last Trade Date
d2: Trade Date
t1: Last Trade Time
Averages
c8: After Hours Change (Realtime)
c3: Commission
g: Day’s Low
h: Day’s High
k1: Last Trade (Realtime) With Time
l: Last Trade (With Time)
l1: Last Trade (Price Only)
t8: 1 yr Target Price
m5: Change From 200 Day Moving Average
m6: Percent Change From 200 Day Moving Average
m7: Change From 50 Day Moving Average
m8: Percent Change From 50 Day Moving Average
m3: 50 Day Moving Average
m4: 200 Day Moving Average
Misc
w1: Day’s Value Change
w4: Day’s Value Change (Realtime)
p1: Price Paid
m: Day’s Range
m2: Day’s Range (Realtime)
52 Week Pricing
k: 52 Week High
j: 52 week Low
j5: Change From 52 Week Low
k4: Change From 52 week High
j6: Percent Change From 52 week Low
k5: Percent Change From 52 week High
w: 52 week Range
t7: Ticker Trend
t6: Trade Links
i5: Order Book (Realtime)
l2: High Limit
l3: Low Limit
v1: Holdings Value
v7: Holdings Value (Realtime)
s6 Revenue
g1: Holdings Gain Percent
g3: Annualized Gain
g4: Holdings Gain
g5: Holdings Gain Percent (Realtime)
g6: Holdings Gain (Realtime)
Symbol Info
i: More Info
j1: Market Capitalization
j3: Market Cap (Realtime)
f6: Float Shares
n: Name
n4: Notes
s: Symbol
s1: Shares Owned
x: Stock Exchange
j2: Shares Outstanding
Volume
v: Volume
a5: Ask Size
b6: Bid Size
k3: Last Trade Size
a2: Average Daily Volume
Ratios
e: Earnings per Share
e7: EPS Estimate Current Year
e8: EPS Estimate Next Year
e9: EPS Estimate Next Quarter
b4: Book Value
j4: EBITDA
p5: Price / Sales
p6: Price / Book
r: P/E Ratio
r2: P/E Ratio (Realtime)
r5: PEG Ratio
r6: Price / EPS Estimate Current Year
r7: Price / EPS Estimate Next Year
s7: Short Ratio
PS. I haven't used them all. I have only used the the ones in the formulas above and in the Post I
Well described
Nice post, but would have like to see it all in one post instead of splitting it to two
Excellent write!