ElasticSearch Fielddata Configuration Tuning Part 1
Observations
We have an ElasticSearch cluster that is running fine most of time. However, occasionally our users can submit heavy queries that add a lot of load to the cluster by accident. They typically include aggregations (on scripted fields and/or analyzed fields) over a large period of time without any filters to narrow down the search scope. During the execution of these heavy queries, the cluster usually has high CPU utilization. For some other users, they may see the cluster not responding to their queries. Or they may see error messages popping up on Kibana about shard failures. The original post is published on my blog and I've updated it as a verification.
Root-Causing
After some investigation, we have our eyes on a potential culprit, the fielddata. Although we have enabled doc_value for most of our fields, analyzed and scripted fields cannot utilize this option and have to load their data into the field data cache in heap during sorting or aggregation. Technically we shouldn’t allow users to sort or aggregate on analyzed field because it won’t return meaningful result for them. It’s an option we can use to reduce unnecessary fielddata consumption but in this post we focus on the fielddata configuration.
Knowing that ElasticSearch provides options to limit the field data size through circuit breakers and field data cache size configurations, it’s suspicious to us that they didn’t kick in (or at least we thought they didn’t) during the heavy-load events.
Do we have the right configuration?
Before jumping in, here are some of our system spec:
- ElasticSearch version: 1.7 (I know, I know, it’s old legacy stuff. We are going to upgrade.)
- Java Heap memory size: 4 GB
- indices.fielddata.cache.size = "2gb";
- indices.breaker.fielddata.limit = “1.2gb”;
If you have read about the Limiting Memory Usage section in the Definitive Guide, you would notice a problem immediately that the indices.breaker.fielddata.limit is smaller than indices.fielddata.cache.size based on the statement below:
In Fielddata Size, we spoke about adding a limit to the size of fielddata, to ensure that old unused fielddata can be evicted. The relationship between indices.fielddata.cache.size and indices.breaker.fielddata.limit is an important one. If the circuit-breaker limit is lower than the cache size, no data will ever be evicted. In order for it to work properly, the circuit breaker limit must be higher than the cache size.
It’s great that we found an obvious problem so quickly but after reading the documentation a few times, it becomes confusing.
What do they mean?
indices.fielddata.cache.size, according to the documentation,
controls how much heap space is allocated to fielddata. As you are issuing queries, aggregations on analyzed strings will load into fielddata if the field wasn’t previously loaded. If the resulting fielddata size would exceed the specified size, other values will be evicted in order to make space.
indices.breaker.fielddata.limit, according to the documentation,
Elasticsearch includes a fielddata circuit breaker that is designed to deal with this situation. The circuit breaker estimates the memory requirements of a query by introspecting the fields involved (their type, cardinality, size, and so forth). It then checks to see whether loading the required fielddata would push the total fielddata size over the configured percentage of the heap. If the estimated query size is larger than the limit, the circuit breaker is tripped and the query will be aborted and return an exception. This happens before data is loaded, which means that you won’t hit an OutOfMemoryException.
Based on this explanation, the circuit breaker guards against large request and prevents data from loading into the heap. However, this is proven not the case in the experiment described below.
Aside from this, there is another section that contradicts statement above:
However, with the default settings (unbounded fielddata cache size), the fielddata from the old indices is never evicted! fielddata will just keep on growing until you trip the fielddata circuit breaker (see Circuit Breaker), which will prevent you from loading any more fielddata.
Wait. Isn’t the circuit breaker guarding against queries? Why would the growing fielddata trip it?
Experiment
We couldn’t find answers about this online so we decided to do our own experiments to find out.
Preparation Step 1 Reconfigure the circuit breaker
We don’t have much data on our test environment so we have to lower the circuit breaker configuration. The command below sets the breaker to 200mb instead of 1.2 gb on the fly.
curl -XPUT 'localhost:9200/_cluster/settings?pretty' -H 'Content-Type: application/json' -d' { "persistent" : { "indices.breaker.fielddata.limit" : “200mb" } } '
To confirm that the circuit breaker is changed, we can use the command:
curl -XGET 'localhost:9200/_nodes/stats/breaker?pretty'
Preparation Step 2 Clear the cache
We want a clean slate for the experiment. The command below clears the cache on all the nodes:
curl -XPOST 'http://localhost:9200/_cache/clear?fielddata=true'
This is also a command that we repeated multiple times during the experiment.
Preparation Step 3 Pick a query
I can’t show the query we run on our internal system here but basically it’s a sort request over an analyzed field over two months.
Confirming the Fielddata Consumption Pattern
Running a few queries confirms the following facts:
- Purely loading the fields (either analyzed or not) does not increase field data usage.
- Sorting unanalyzed fields does not increase field data usage.
- Sorting analyzed fields does increase field data usage.
- Fields marked as ? (boolean) are treated like analyzed string fields. This is weird and should be a separate issue to investigate.
Experiment Entry on Oct 11th, 2017, Triggering Circuit Breaker
Procedure
- Clear the cache.
- Run a sort query in Kibana on an analyzed field A.
- Check the field data consumption. On average each host has around 193 MB data.
- Clear the cache.
- Run a sort query in Kibana on another analyzed field B.
- Check the field data consumption. On average each host has around 193.9 MB data.
- Without clearing the cache, repeat step 2 with the query on field A.
Expectation
The query in step 7 should go through without any problem. Total field data on each host should be around 400 MB.
Result
We got shard failure instead, complaining the field data size is too large. Total field data size was less than 200 MB (to be precise, it was 199.75 MB). Only partial data was returned. Using the following command we can see the cache consumption per host per field: curl -XGET 'localhost:9200/_cat/fielddata?v&pretty’.
Implication
- It seems that we have tripped the circuit breaker and confirms the statement that “fielddata will just keep on growing until you trip the fielddata circuit breaker (see Circuit Breaker), which will prevent you from loading any more fielddata”.
- It contradicts our understanding that circuit breaker limits heavy queries before loading data into heap. Data was loaded.
- It seems that circuit breaker should not be smaller than the cache size as mentioned at the beginning of this post.
Experiment Entry on Oct 12th, 2017, Changing the Cache Size Limit
To confirm the 3rd point above, I decided to lower the cache size limit below the circuit breaker. Cache Size Limit cannot be updated on the fly so we have to do a code change in the config file:
indices.fielddata.cache.size = “100mb”.
The assumption here is that once the field data cache fills up more than 100mb, some cache will be evicted.
Procedure
- Clear the cache.
- Run the same sort query in Kibana on an analyzed field A, which should load about 193 mb.
- Check the field data consumption.
- Run the same sort query in Kibana on an analyzed field B, which should load about 193.9 mb.
- Check the field data consumption.
- Run the same sort query in Kibana on an analyzed field C, which should load about 16 mb.
- Check the field data consumption.
Expectation
No request should be blocked and we should see cache eviction.
Result
I’m hiding all the IPs, node names as well as logins for obvious reasons ;)
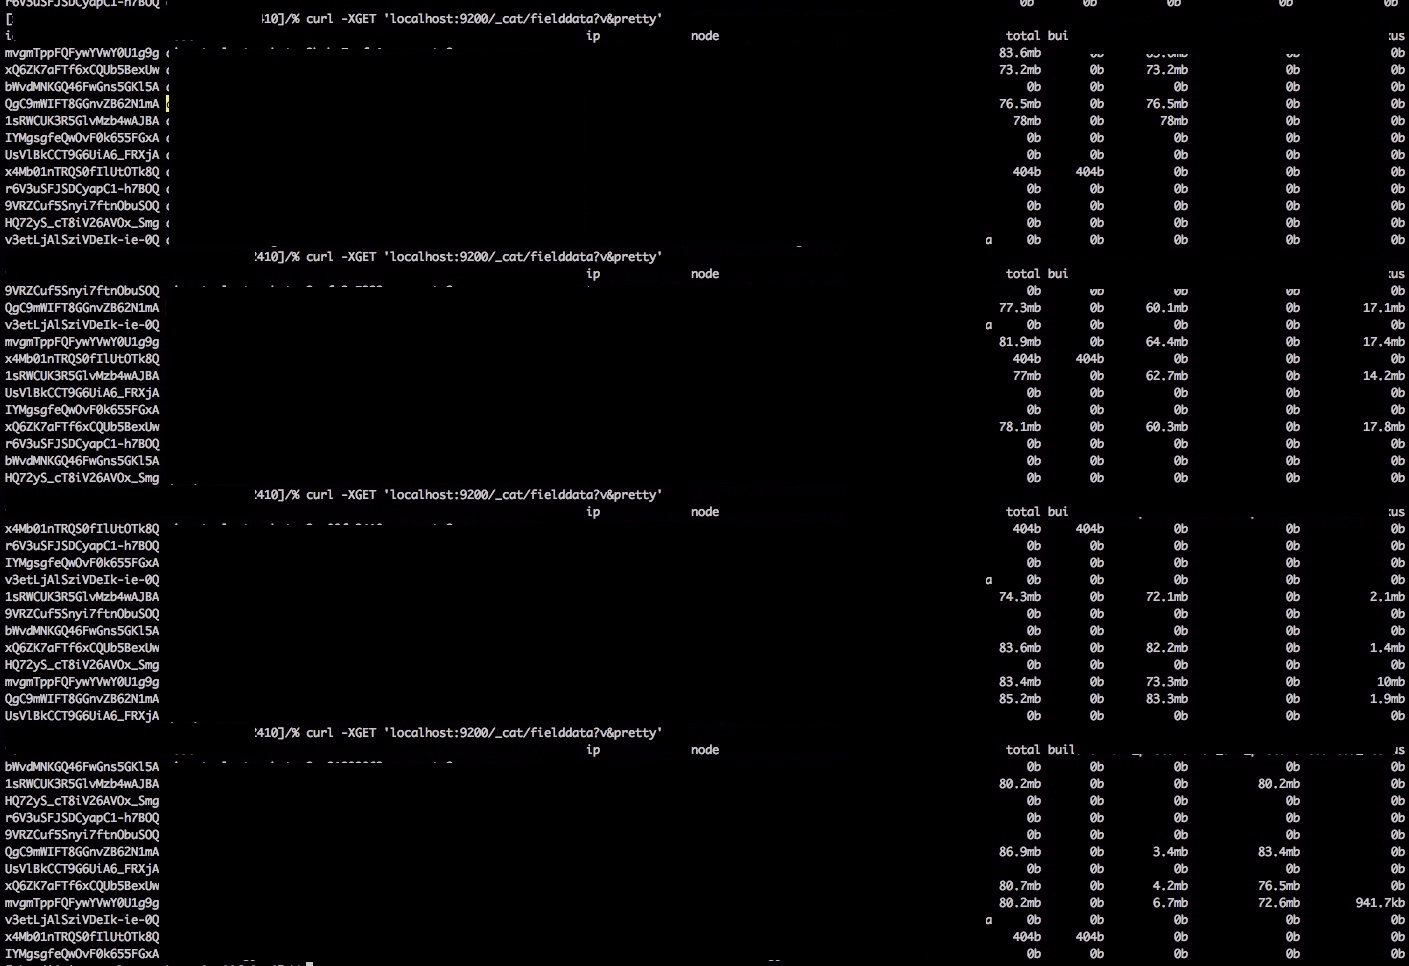
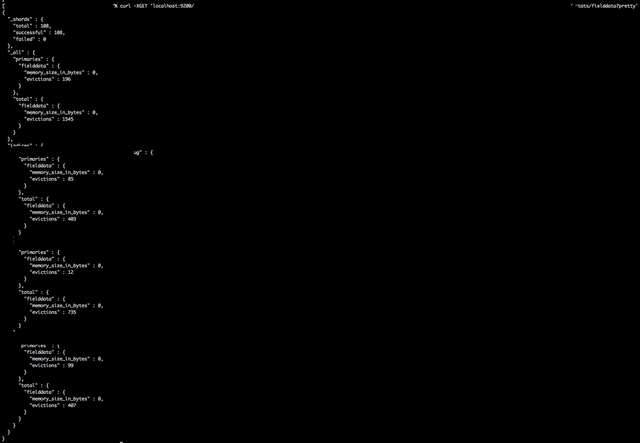
As shown above, every time we sent a sort request, it evict previous cache to make space. The total cache size is always below 100 mb (around 85 mb). We can also find the eviction number increased, proving that eviction happened.
Before
After

Implication
It seems that we have solved the shard failure problem by switching the circuit breaker and cache size limit and evicting cache. However, one thing to keep in mind is that
Evictions cause heavy disk I/O and generate a large amount of garbage in memory, which must be garbage collected later on.
Eviction is fast on beta because we don’t have much data there but for prod, evicting big cache object could trigger big GC and halt the cluster.
How long does it take to evict and GC all the cache?
Across all nodes on beta we have 240 mb took about 1 second to do GC. On production each host has 2GB, so it is at least 10 seconds for each. This is under the assumption that the relation here is linear, which is almost not true since the production cluster are under a lot load.
The Unknown
Q: What is the order of data loading and the cache evicting?
A: If it were to load data first, we should hit the circuit breaker first. Most likely, it’s loading and evicting at the same time. This raises another question: What if the circuit breaker is 150 mb? What would happen to the first query loading 190 mb of data?
Experiment Entry on Oct 13th, 2017, Circuit Breaker at 150 mb
Following the same procedure above after changing the circuit breaker to 150mb, it gave us the same result. Total cache below 100 mb and no shard failures were found during the experiment.
However, the tricky thing is that there is only 100 mb difference between our query and cache size limit. After evicting, the remaining amount is less than 150 mb of the circuit breaker.
What if our circuit breaker is 2.5 GB and the cache size limit is 1 GB and we send a 4 GB request? After evicting, we still have 3 GB of data, larger than the circuit breaker. Will it break? Will it continue evicting until it is below 1 GB? How would the cluster behave during this process? It is something we need to dig further.
Discussion
Our production configurations:
- indices.fielddata.cache.size = "8gb";
- indices.breaker.fielddata.limit = "30%"; // which is 4.5gb out of 15gb.
If we look at our normal usage of field data on NA, it is stable at 2 to 3 gb per host. It’s only when some heavy requests that try to load over 3 GB of data, the fielddata is filled up. Since our cache size is set to 8 gb, it will never evict anything. When that happens our users get a shard failure error.
So should we increase the field data limit over 8 gb? Not really. Doing that means allowing heavy requests that load more than 8 gb of data. This could cause problems:
- First of all, why does a single query need more than 60% of our heap memory? Since our normal field data size stays around 3 gb per host on a weekly basis, there is a high probability this type of request is abnormal.
- Second, if the field data cache size is already around 8 gb, allowing a heavy query by evicting old cache is going to have high I/O and large GC. The cluster basically has to evict almost all of the cache to allow such a query. The large GC could halt the cluster for an extended period of time, appearing unresponsive to the users.
Just because we can, it does not mean that we should. According to this post A heap of trouble, they suggest to set the size of the heap below 4GB or close to whatever limit that satisfies the normal daily usage.
Less is more
It's better to set the heap as low as possible while satisfying your requirements for indexing and query throughput, end-user query response times, yet large enough to have adequate heap space for indexing buffers, and large consumers of heap space like aggregations, and suggesters. The smaller that you can set the heap, the less likely you'll be subject to detrimental long garbage collection pause, and the more physical memory that will be available for the filesystem cache which continues to be used more and more to great effect by Lucene and Elasticsearch.
Proposal
Based on the discussion above, we have our first proposal on lowering the fielddata cache size while keeping the fielddata circuit breaker untouched:
- indices.fielddata.cache.size = “4gb";
- indices.breaker.fielddata.limit = “4.5gb”;
This is because 4 GB is enough for the majority of our users. If the size goes above it a bit, we want the cluster to evict the least used cache. The only concern we have right now is when someone submits a heavy query that consumes 5 GB of data, would the cluster keep evicting cache until it fits under 4 GB or reject the query with a shard failure because the eviction is not fast enough? During eviction, is the GC going to halt the cluster for a long time?
Part of our coming week is to carry out this proposal on a Production-like stage to gather more data and I’ll come back with another post on this topic.
Thank you very much for sharing inspiring content.