Lab Diaries #6 - Gene Set Enrichment Analysis (GSEA) of a Large-Scale Biological Data, Part II
Performing the GSEA analysis
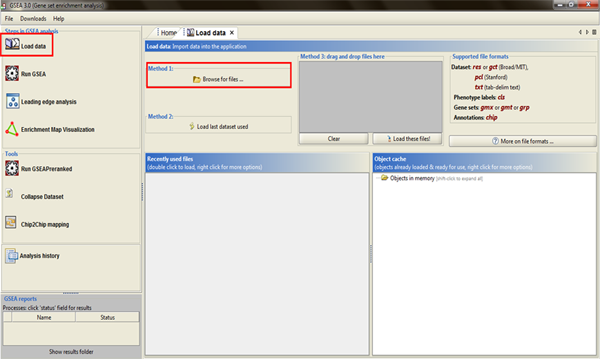
After you have opened your GSEA software, first thing you want to do is to load data files (.gct and .cls) you previously created.
You will do this by clicking Load data in the left panel, and then by selecting Method 1: Browse for files:
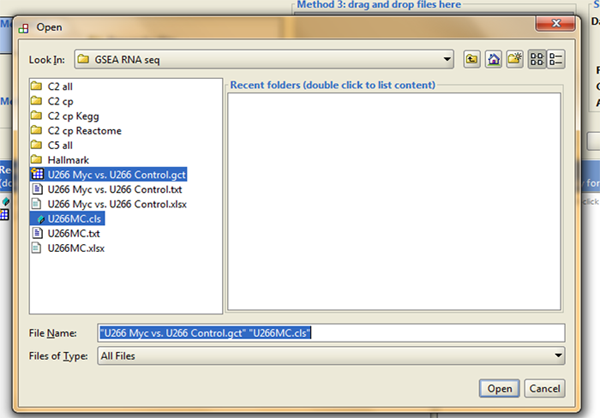
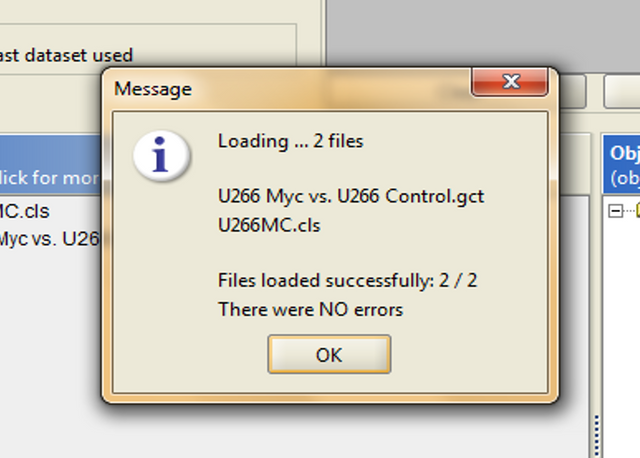
A pop-up window will show up, taking you to your local folder where you need to find your GSEA files (data file - .gct and phenotype label file - .cls), they should look like in the image below, and both of them should be selected/loaded into the software:
Run GSEA - Set parameters
To be able to perform GSEA analysis properly, first you need to select running parameters that best fit your needs. This of course means that you need to know what you're doing, otherwise it doesn't make much sense, right? :)
In Run GSEA window you can see that adjustable parameters are divided into Required fields, Basic fields and Advanced fields. We will keep our settings within Required and Basic fields for this tutorial.
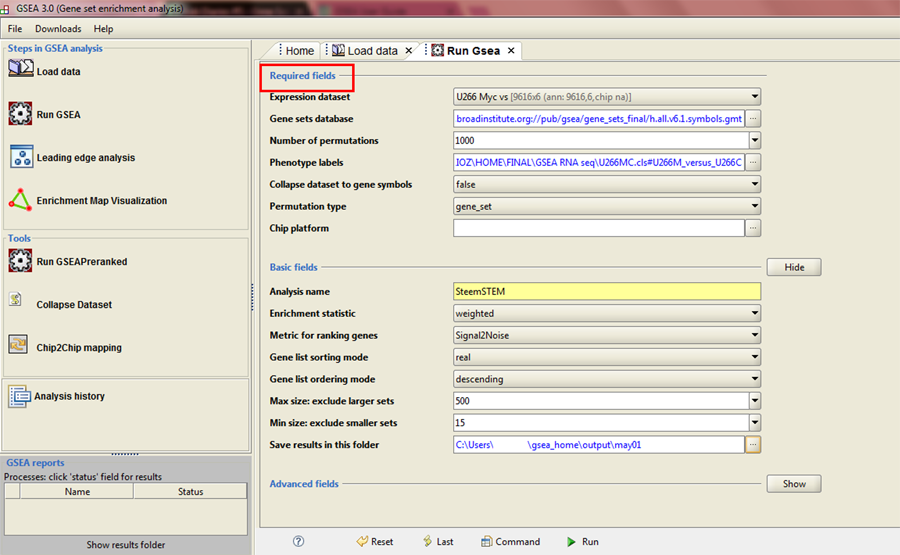
Required fields
Expression dataset
In this drop-down menu you need to select .gct file you previously loaded.
Gene sets database
This is where you select a collection of gene sets you want to use, depending on biological context you want to test your data for. On this page you may find detailed descriptions of all gene set collections available in the GSEA software.
I usually analyse my data by using several collections, and then see what results make most sense to my particular biological question.
For this particular analysis, I have selected Hallmark collection.
Number of permutations
During the process of determining the statistical significance of the enrichment score, GSEA performs certain number of gene set permutations. It is recommended to use maximum number of permutations that won't make GSEA run out of memory, which is 1000.
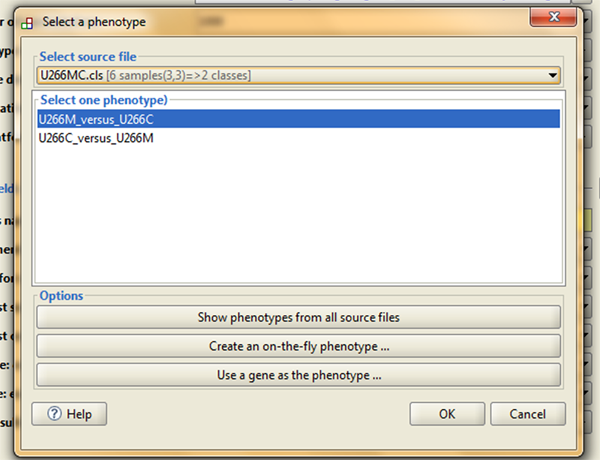
Phenotype labels
Here you need to select phenotype label (.cls) file you previously loaded. In the pop-up window you will have two options, and you should always go for phenotype labels file that puts your investigated phenotype first, and then your control phenotype (I will explain in the next post why this is important):
Collapse dataset to gene symbols
Very important parameter to set up. What is this about actually?
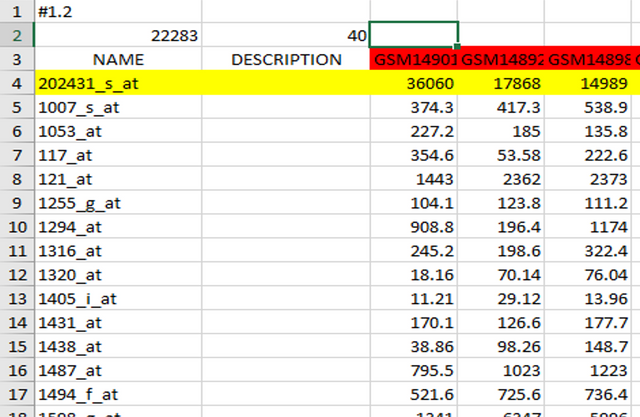
Genes in expression data can be annotated in two ways - in form of gene names/symbols, and in form of microarray chip annotations (for those expression data obtained by microarray analysis):
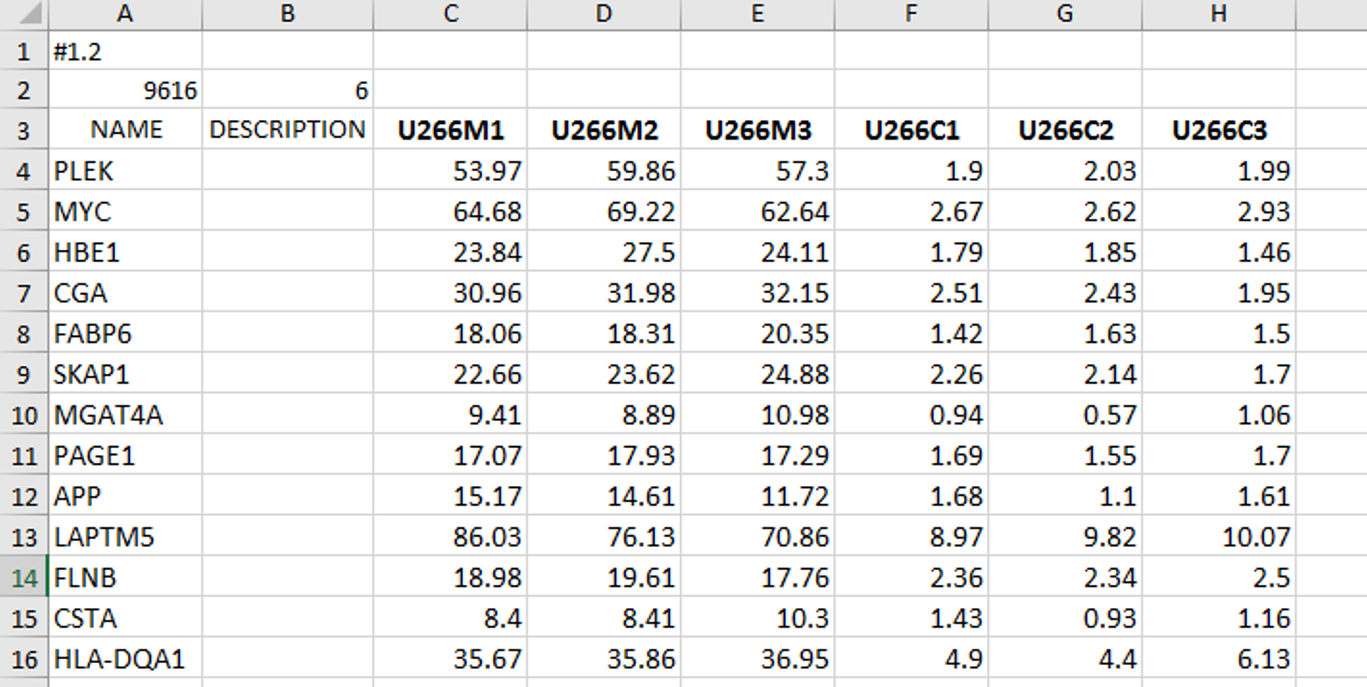
In cases when your input data contains gene names like in the image on the left, you should select false, which means that GSEA will use input gene names as they are when generating output files - results.
On the other hand, when you have microarray chip annotations, you need to select true, meaning that GSEA will "translate" those annotations which are not informative for us into gene names when generating analysis results.
In our analysis I have selected false because I already have gene names in my input data file.
Permutation type
Also very important parameter to consider changing according to your input data. You can choose between gene_set and phenotype permutation. The best way to explain the difference between those two is to use the explanation from GSEA Tutorial:
Phenotype. Random phenotypes are created by shuffling the phenotype labels on the samples. For each random phenotype, GSEA ranks the genes and calculates the enrichment score for all gene sets. These enrichment scores are used to create a null distribution from which the significance of the actual enrichment score (for the actual expression data and gene set) is calculated. This is the recommended method when there are at least seven (7) samples in each phenotype.
Gene_set. Random gene sets, size matched to the actual gene set, are created and their enrichment scores calculated. These enrichment scores are used to create a null distribution from which the significance of the actual enrichment score (for the actual gene set) is calculated. This method is useful when you have too few samples to do phenotype permutations (that is, when you have fewer than seven (7) samples in any phenotype).
If you have at least seven samples in each phenotype, it is recommended to go for phenotype permutation type, because with this permutation type GSEA preserves correlations between the genes in the dataset and the genes in a gene set, while performing phenotype permutations.
If you have less than seven samples within one phenotype (like in our case here), you need to go for gene_set permutation, however, this will have important implications on your data analysis that you need to be aware of - the evaluation of significance of enrichment score will be less stringent, meaning that you must use more strict FDR cut-off when analyzing your data (to be explained).
Chip platform
In case you have microarray expression data and you have selected "Collapse dataset to gene symbols - true", this is where you have to select microarray platform and chip type used, so the GSEA could collapse annotations to gene symbols properly.
Basic fields
Basically here all you will ever have to change is your analysis name, I named my analysis SteemSTEM, this is useful because this is how the folder containing all your GSEA data will be named, and another thing you may change (but it's not mandatory) is the destination folder where your results will be stored. By default, this folder is located in C:\Users\Username\gsea_home\output\date, and you can keep it there, or put it wherever you like.
Running the GSEA
If you got to this part - congratulations! You can finally perform your GSEA analysis, and hope for the best! ;)
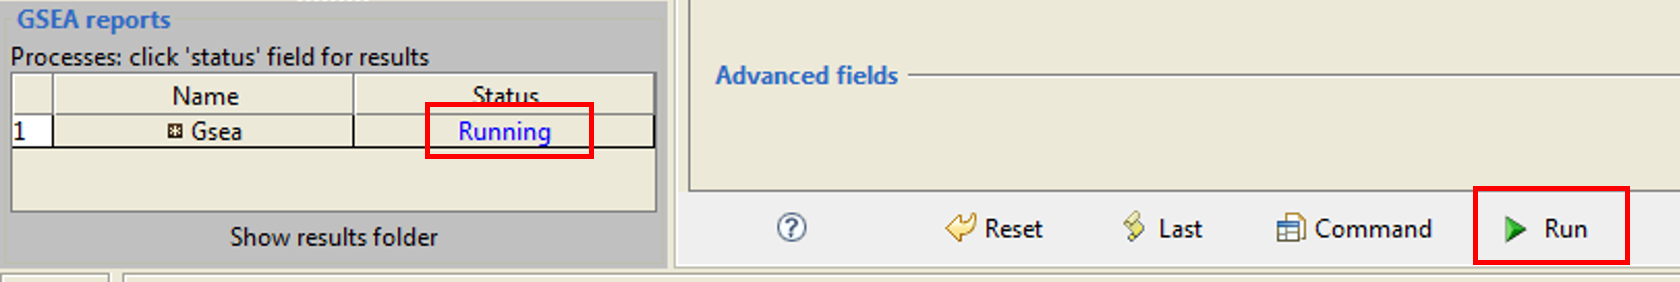
In the lower right part of the screen, you will click the Run button, and on the left you will get status in blue letters - Running:
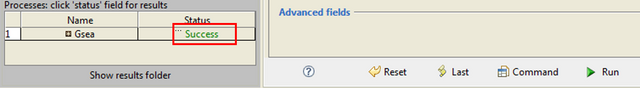
When the analysis is finished, you are supposed to get the "Success" message:
Otherwise, you can also get "Error" message in red letters, meaning that you messed something up, in that case this is what you do:

In my endless days of learning this, it took me lots of trial and error attempts to finally reach the part where I can run the analysis, and when I would see the "Success" message on the screen, it was a real success to me!!!
Hope you enjoyed this tutorial, or at least the funny part of it :)
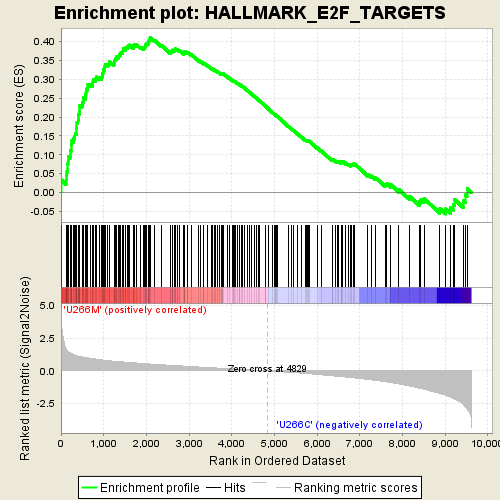
Next post will be dedicated to deciphering of GSEA results.
Until then, relax and keep steemSTEM! ;)
Literature
[2] GSEA User Guide

I've no idea what u wrote.
But that Harvard Uni stress release therapy is super cool tech, i can see..!!! xD
Dont forget to keep some fun part in next article too.
At least i feel genius to be able to understand that part...! :D
Anyways, Best regards dear..!🙌
~ Christina
No worries, always try to include fun parts, although they're not needed, because with science you get all the fun you need! :D
Being an angel in tough...
And we all think it's easy, just wearing white and effortlessly flapping with the wings
I assume this is another way of saying "Dude, seriously, nobody's gonna read this!"
5 min of reading + practising on the computer mixed with 5 min of catwalk video of Victoria's secret angels makes it possible
Consider yourself lucky for not getting flagged for this comment ;)
Great article @scienceangel!
Thank you very much dr Rhodes!
Hi @scienceangel I have no idea about biology, so please excuse me if the following question if a dumb question.
I am interested to know how you will use this information to help you with your cancer research?
Hi @terrylovejoy, thank you very much for stopping by, this is actually a very good question!
The results of GSEA will tell us which pathways are changed/influenced by the overexpression of our gene of interest. Why is this important?
We know from published literature data that particular oncogene we're investigating is overexpressed in variety of cancers, as well as in multiple myeloma which we study. Also, it was found that many myeloma patients develop resistance on available treatment regimens, and we hypothesized that it has something to do with overexpression of our gene of interest.
This is why we created transgenic cells in which we overexpressed that gene, to detect changes in signalling pathways induced by this event. GSEA will aid us greatly in this.
Once we establish what are the changes in pathways induced by oncogene overexpression, it will help us in further research on what are the new drugs that could potentially target population cells exhibiting resistance on standard treatment.
Thank you that was an excellent explanation!
@terrylovejoy : You understood the term pathway? @scienceangel : I think a beginner who reads this comment may want an explanation about this term I guess.
@dexterdev lol :)
By definition, a biological pathway is a series of actions among molecules in a cell that leads to a certain product or a change in the cell.
Even though there is still some technical jargon in there it gave me a feel for the importance of the work. Yep, I did have to go off to wikipedia for a few terms like oncogene ("cancer gene"), myeloma, etc. But I am good with that! It still gave me some context to her work.
As I said I don't have a biology background, but I am keen to understand the type of research that is happening with cancer as I have already had to grieve the loss of 2 people close to me because of it :( I had a cousin pass away at age of 12 many years ago (I think it might have been some form of myeloma).
Its great to see the contribution of real life scholars into steemit platform. U r researching with genes causing cancers nd thanks for sharing ur lab data with us. I'd never come across RNA seq data before and it seems like u people are doing super cool research with all these genes and RNAs.
Best wishes for ur team, angel.
Thank you very much @ied! :)
Cool. I can only imagine how that software makes data processing and analysis much easier for you guys.
I wonder how scientists do it before softwares like this were available...they manually determine the overexpressed genes and protein from large set of data.😥😥
Hi @anneporter, actually they didn't, because they didn't have any data to analyse :)
The development of the large-scale methods had to go in parallel with development of methods for analysis of such data, otherwise scientists couldn't possibly analyse them.
Thank you very much for stopping by and reading! :)
Yeah i forced my brain to understand what's going on. But its really cool....this inspire me to take up my masterrs 😭