Realisation of Optical Cavity and Implementation of Red Pitaya Electronics Board.......Personal Report.....
Introduction
The purpose of this report is to summarise my stage, where I was tasked with realising an optical cavity using the Red Pitaya as the prime instrument. To realise the cavity involved important steps, I prepared a Gaussian beam which had to be designed to suit the cavities characteristic beam waist of 369 micro meters, so the optical set-up had to be designed to provide such profile in order to satisfy mode matching condition between cavity resonant modes. The beam profile had to be measured to confirm the existence of the desired beam waist and its precise location so that the triangular cavity could be placed at the Gaussian waist (Figure 1). When the cavity was put in place, I first aligned the spatial modes of the cavity with mirrors and screws, I was then able to tune slightly the cavity frequency response with the piezo. The Fundamental Gaussian TEM_00 mode had to be isolated by fine tuning the mirrors and path length. In order to take accurate measurements, the laser had to be locked with the Cavity, correcting any fluctuations in path length due to laser or thermal fluctuations. The Pound-Drever-Hall technique was used to locked the Laser and was implemented using the Red Pitaya and PyRPL software. This finally allowed for a measurement of the Free spectral range of the cavity, and a low noise spectra of the transmission signal after locking and isolating the fundamental Gaussian mode.
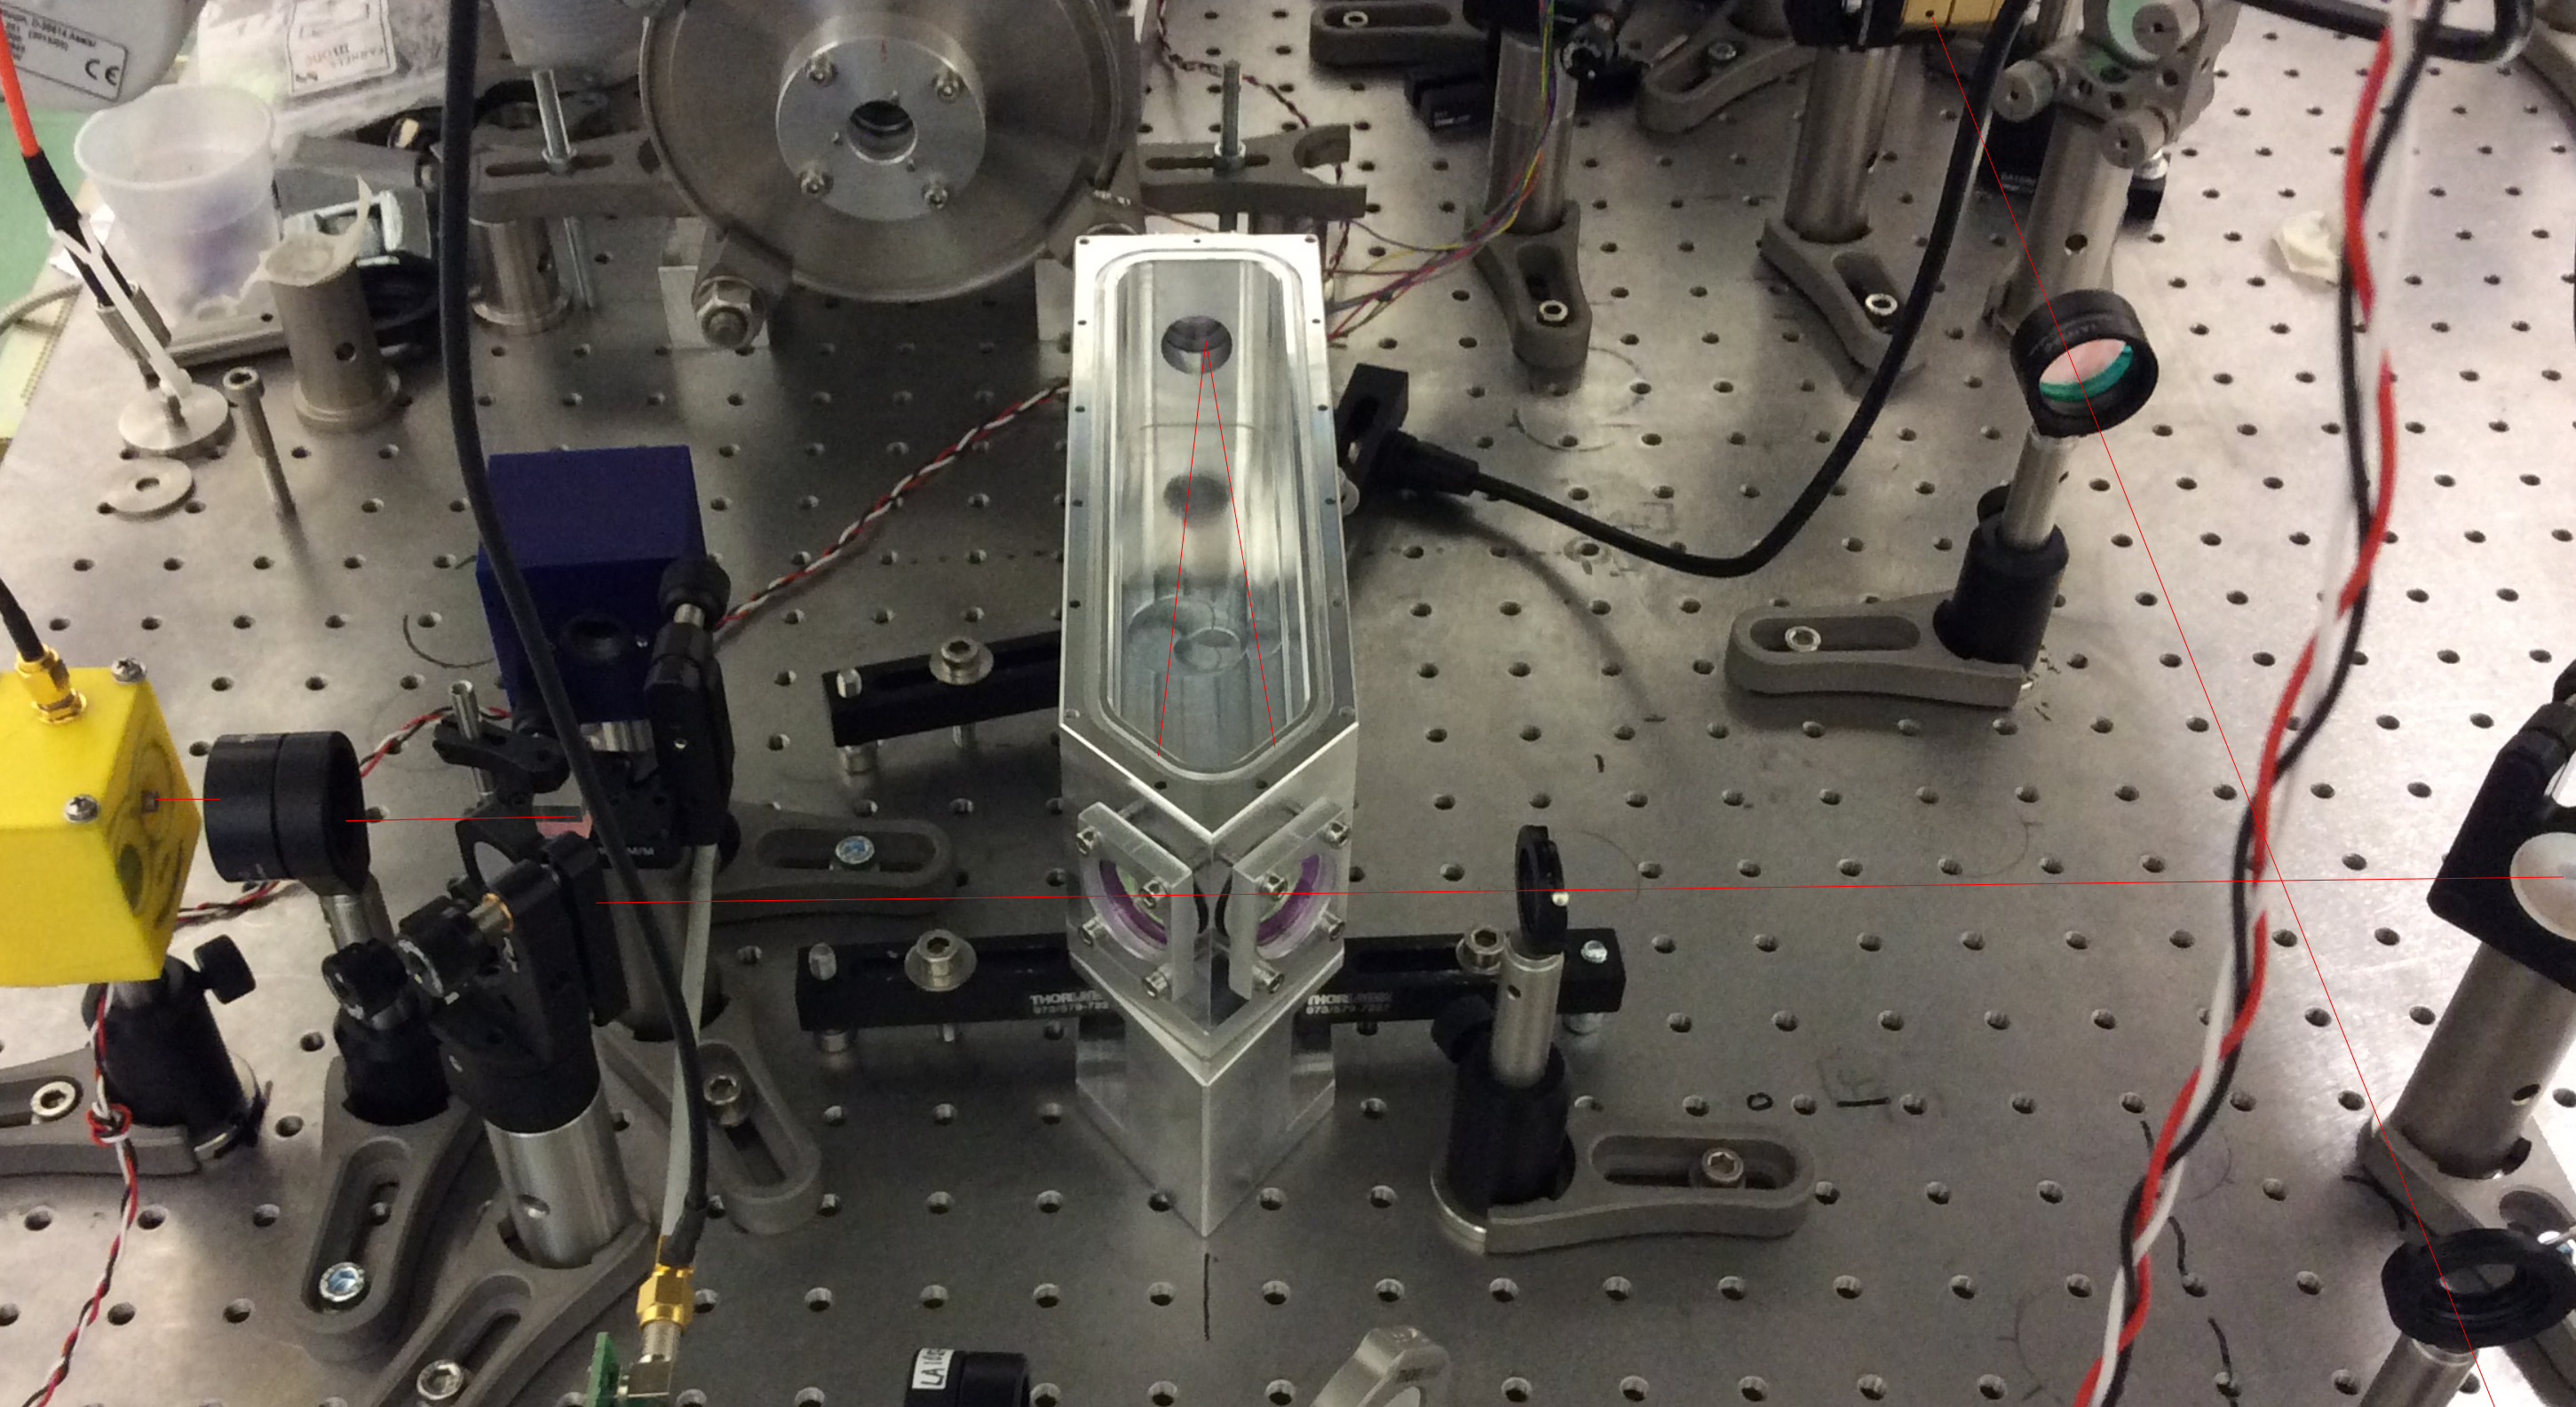
Figure 1

Gaussian Beam Profile
As mentioned the design of the cavity resulted in a characteristic cavity Gaussian beam waist of w_cav= 369 micro meters meter positioned at the centre between the two flat mirrors at 10 mm. These values were calculated using the Finesse software. Using mode matching software, the position of the lenses needed to produce a Gaussian waist to match the cavity were calculated. The Laser used has a wavelength of 1064 nm, and a beam waist at the Laser Head of w_Las Head= 160 micro meters, with this information of the beam size the mode matching software can generate the positions of the lenses available to produce a waist equal to the cavity Gaussian beam waist of w_cav= 369 micro meters. The design can be seen in Figure 2. With this information the optical bench could be designed with the relevant components placed in suitable positions considering the available space on the optics table (Figure 3).

Figure 2

Figure 3
Note that, before setting up the components, the lasers profile had to be measured to ensure the existence of the desired beam waist and it's location. This proved to be problematic but was eventually completed successfully. In Figure 4, you can see two Gaussian profile plots, in magenta is one of the trials, and in red is the final measurement, which was close enough to the desired waist size, small adjustments could be made later.

Figure 4
Red Pitaya and PyRPL software
The Red Pitaya Board is an electronic hardware board intended to be an alternative to expensive laboratory control and measurement instruments. Important features of the hardware include two 125 MSamples/s RF input ports, and two 125 MSamples/s RF output ports, it has a 50 MHz analogue bandwidth with a 10 bit AC-DC converter. The Red Pitaya is supplied with default software which includes an oscilloscope, spectrum analyser, signal generator, LCR meter, and two 50 MHz PID controllers. It is re-programmable to allow it to become used for other reasons due to the fact that the input/output ports are connected to a FPGA (field programmable gate array). The device can be connected to a network (LAN/WIFI), allowing for remote communication and control, which was the option of choice through the stage. The Red Pitaya was communicated with using Python Computer language.
PyRPL is an open-source software that turns the Red Pitaya board into a range of instruments useful for the purpose of Opto-Mechanics and provides a user friendly GUI. The software has a number of useful acquisition modules such as an Oscilloscope, Network analyzer, and Spectrum analyzer. Other useful modules that are present consist of a PDH signal generator in the IQ module, a Phase-Frequency detector, and a Tunable band pass filter. However modules of interest in this stage are the lockbox module and the PID module that was implemented to create a Pound-Drever-Hall locking of the laser to the cavity.
Some adjustments were needed to for the functionality of the PyRPL software, this was due to the demands of locking the triangular cavity. It was possible to lock the laser to the cavity for fast fluctuations using the standard software, but the cavity would slowly drift away from locking due to slow thermal fluctuations. A control was added to the lock box module of PyRPL that would account for the thermal fluctuations. One this was achieved, with the right configuration of the Red Pitaya with PyRPL it was possible to stabilise the locking of the laser, which allows for stable measurements.
Cavity Stability
In order to measure the Free Spectral Range (FSR) of the cavity, we take advantage of the modulation performed by the EOM. The EOM produces a modulation at the frequency f_mod = 25 MHz, which produces side bands that are separated from the resonance peak by the modulated frequency f_mod. So by sweeping the signal with a ramp wave form at high voltage, such that the piezo changes the path length of the cavity over a FSR, we can see in the time domain (Voltage vs Time) the multiple resonance peaks with the side bands. The time separation of two resonance peaks T relates to the FSR, such that FSR = 1\T. So with such a signal it's possible to infer the FSR, using direct proportionality in the time domain. In Figure 5, we can see the ramp signal (in green) that was used to change the size of the piezo in order to scan the cavity over many free spectral ranges. In blue is the PDH signal and in red the peaks that correspond to the TEM_00 Gaussian mode, in which the Laser is locked onto. You can notice in the cavity mode peak plot that there are smaller peaks which are associated with higher order TEM modes, so the fundamental mode was not completely isolated and mode matched perfectly. Figure 6 shows a "zoom" of a single PDH signal and cavity mode peak.
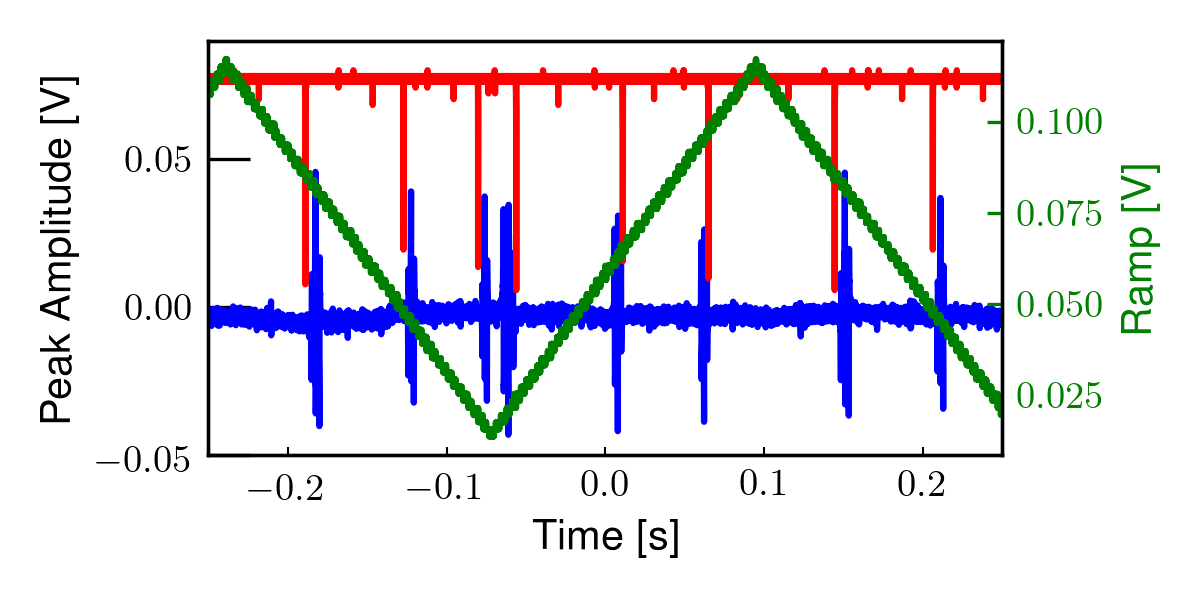
Figure 5
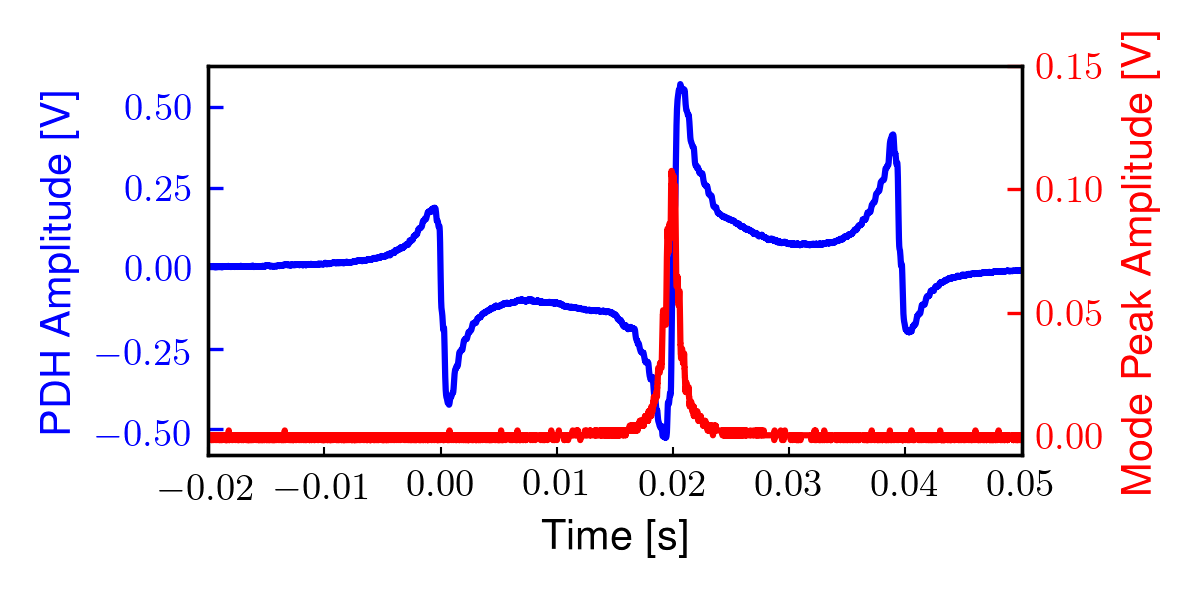
Figure 6
A problem occurred with the symmetrical expansion and contraction of the piezo, the problem with the measurement error is due to non-linear response of the system (cavity and rubber, washer and piezo), so ramping the signal meant that the peaks displayed in the data were not perfectly separated by the same time and thus FSR. The Expected FSR was 742 MHz, the data provided various FSR values due to the problem with the piezo, however the the values were of the same order of magnitude. FSR_1 = 504 MHz, FSR_2= 656 MHz, FSR_3 =719 MHz, the greatest discrepancy being in FSR_1 with a difference from the expected value of 29.9 per cent, and the lowest in FSR_3 with 3.1 per cent discrepancy. With out further information about the deformation of the piezo it is difficult to know exactly how much the true error is.

Figure 7
Figure 7 shows the transmission signal of the photo diode before the locking attempt (before red line), during (after red line), and after (after green line). Notice the spikes in the transmission as the PDH locking scheme tries to account for fluctuations with a PID. The fluctuations are due to thermal fluctuations of the cavity as the TEM_00 Gaussian mode must be located with the heat of the hand, which is then accounted for in the PID as it relaxes. After about 220 s the system stabilises and no more fluctuations in intensity can be seen.

Figure 8
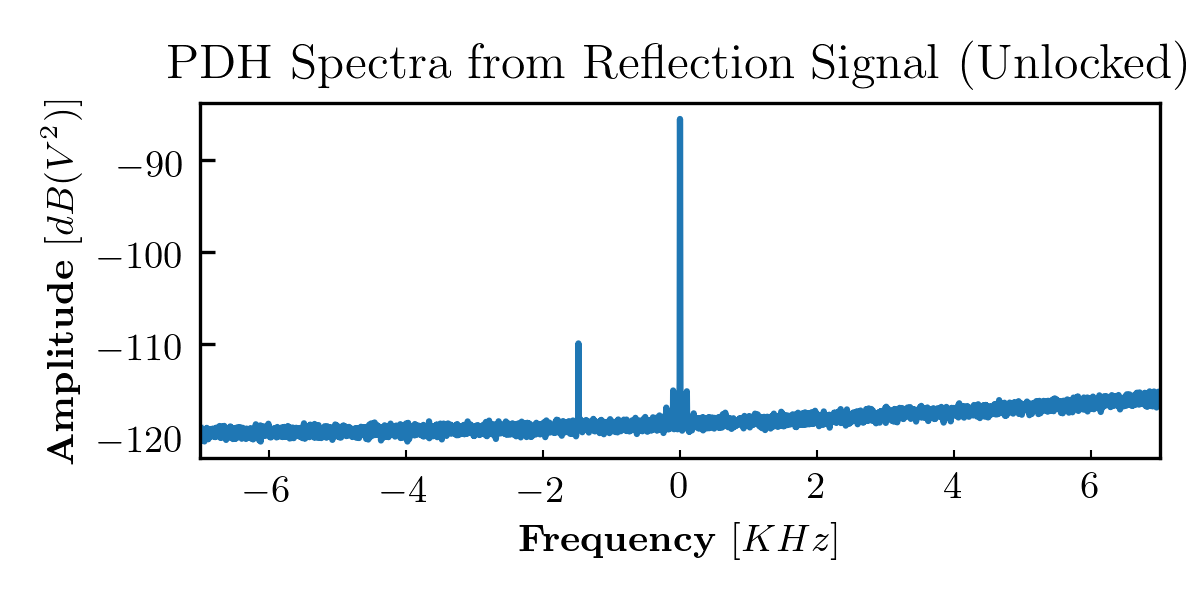
Figure 9
Figure 8 shows the spectra of the reflection signal that has been modulated with the PDH signal, for comparison Figure 9 shows the unlocked spectra. There is a lot of noise peaks over the band width associated with the locking, one of the causes is the AC powering the Red Pitaya at 50 Hz. The PDH implementation must be improved for use through the Red Pitaya and this is something that will be worked on. A DC power supply should be used and fine tuning of the parameters in the lockbox module of PyRPL.
Conclusion
The Cavity acts like a filter, it only allows a small band width to transmit through. It acts to filter the TEM_00 Gaussian mode. It can be seen that the fundamental mode has not been completely isolated due to the small peaks in the cavity mode plot, however the fundamental mode is dominant. A Free Spectral Range of FSR = 719 MHz was inferred from the data acquired whilst using a sweeping signal on the piezo, however error exists due to anti-symmetric expansion and contraction of the piezo. The Red Pitaya was successfully used to implement a PDH lock which can be seen by the stability plot. The locking allows to obtain further data to be used throughout this short report. A PDH locking signal sent to the piezo shows a wide range of frequencies utilised in the locking. By locking the Laser to the cavity at the fundamental Gaussian TEM_00 mode, it can be seen from the spectra that the cavity suitably filters out the noise and acts as a good pre-mode cleaner.
If you enjoyed this post, feel free to Upvote, Follow and Resteem
All images used in this post are my own. You are welcome to use them with credit.
References are contained in Hyperlinks throughout the artcile. Everything else is my personal work.

This post has received a 1.49 % upvote from @drotto thanks to: @physics.benjamin.