Evidence of ferromagnetism in the diluted magnetic semiconductor CuGaMnTe2
Hi there every body, I´m back with some new and unpublished information that could be of interest to the Physics and Semiconductor communities. During the last 3 decades, I have been involved in many scientific projects related to the optical, structural, and magnetic properties of Diluted Magnetic Semiconductors, or, as many colleges have termed “Semimagnetic Semiconductors”. What I have learned from these materials, is that, when the pure semiconducting host is randomly doped with a magnetic species (Mn, Cr, Fe, etc.) the whole system displays a paramagnetic behavior. However, in some of compounds different magnetic phases could be present, such as a ferromagnetic phase. Here, I bought to you experimental and theoretical evidence of a ferromagnetic-paramagnetic phase transition in the diluted semiconductor CuGa1-xMn1-xTe1-x, using the Ferromagnetic Resonance (FMR) technique, in the framework of a model for single domain uniaxial grains.
For more information on Magnetism, Magnetic Materials, and related subjects, feel free to follow me at:
Introduction
The alloys CuGaTe2 belong to the family of ternaries I-III-VI2, well known by their potential applications in photovoltaic and solar technology [1]. These compounds crystallize in the chalcopyrite structure and exhibit high absorption coefficient with energy gap near to the optimum range for conversion of solar energy [2]. When a transition metal ion, such as Mn, is diluted into the semiconducting matrix, the impurity randomly substitutes the Ga ion, giving to these alloys different optical, electrical, and magnetic properties not observed in the non-doped counterpart. In particular, as the magnetic element enters the lattice by random substitution, the magnetic moments of Mn are also randomly oriented, giving to a paramagnetic order phase. This is the case in CuGaS2 and CuGaSe2 [3, 4], and it is expected to found the same magnetic behavior in CuGaTe2. This is the case in CuGaMnS2 and CuGaMnSe2 [3, 4], and it is expected to found the same magnetic behavior in CuGaMnTe2. However, earlier reports suggest the possibility of a ferromagnetic-superparamagnetic transition in CuGa1-xMnxTe2 [5, 6]. The origin of ferromagnetism in a diluted semiconductor material yield nowadays to theoretical controversies: since ferromagnetism is a collective phenomenon, in diluted system this could not be the most general rule. However, there are some characteristic features that distinguish a FM material from a non-FM: the uniaxial magnetic anisotropy. This has been well stated in the landmark paper of Stoner and Wohlfarth [7].
Experimentally, several techniques are available for studying the magnetic properties of DMS, however, Ferromagnetic Resonance (FMR) has proven to be one of the most useful tools to test FM and magnetic ordering in diluted, granular, and low-dimensional materials [8]. This is because the ferromagnetic resonance detects the fluctuations of local magnetic fields, which in turn, are highly sensitive to point defects, magnetic impurities, structural inhomogeneities, temperature, etc.
The aim of this note is addressed to report on the ferromagnetic properties of diluted magnetic semiconductor CuGa1-xMnxTe2, measured by Ferromagnetic Resonance (FMR). In the next Section the experimental methods are briefly described. Then without much detail, the theoretical model used to interpret the experimental data is summarized, followed by a discussion of relevant results.
Experiment
Samples of the I-III-VI2 diluted magnetic semiconductor CuGa1-xMnxTe2 with Mn composition x=0.05 to 0.25 were prepared by direct fusion of the stoichiometric mixture of the elements of at least 5N purity in graphite crucibles inside evacuated quartz ampoules (≈ 10-6 Torr). To minimize the risk of explosion due to exothermic reaction between the group III element and Te, the ampoules were heated in a vertical furnace very slowly at 5 K/h up to 1100°C. Kept at this temperature for 24 h, the samples were rocked at regular intervals to achieve a homogeneous mixing of the liquid phase of the reacting mixture, and then cooled to 500°C at a rate of 5 K/h. At this temperature the ampoules were annealed for 4 days. The synthesis route is sketched in Figure 1. The samples were prepared at the Materials Science Lab., University of Zulia, Venezuela.
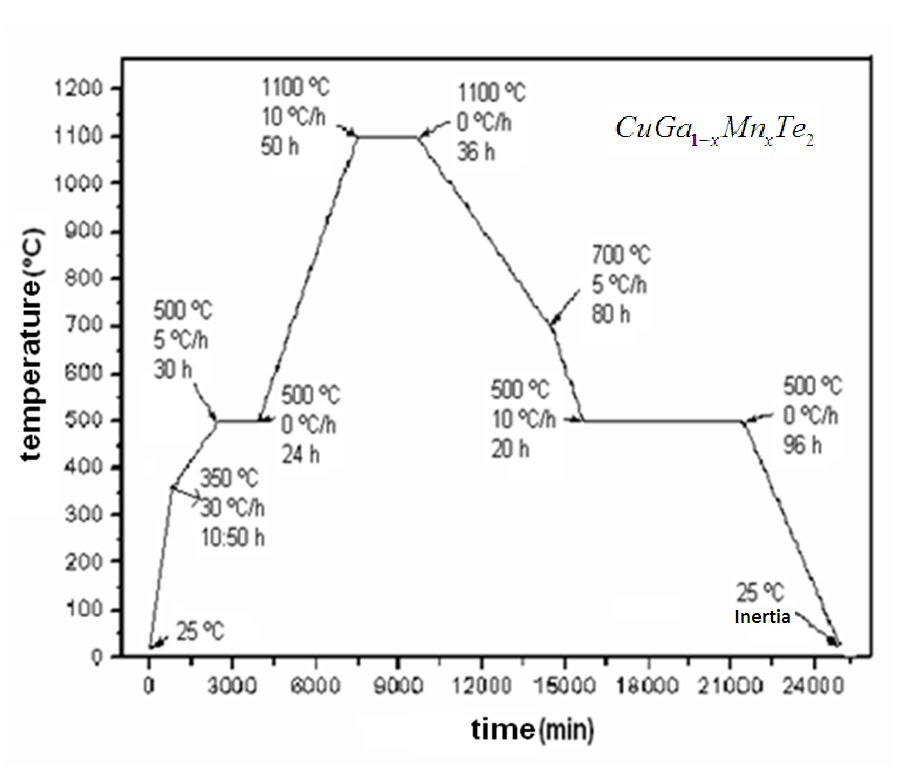
Figure 1. Diagram used for the synthesis of the dilute semiconductor CuGa1-xMnxTe2 (Figure credits: Materials Science Lab., University of Zulia, Venezuela)
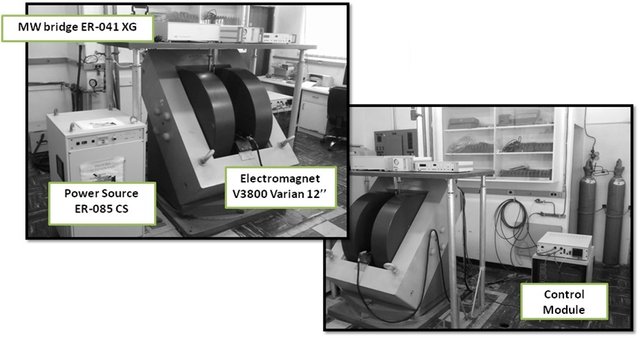
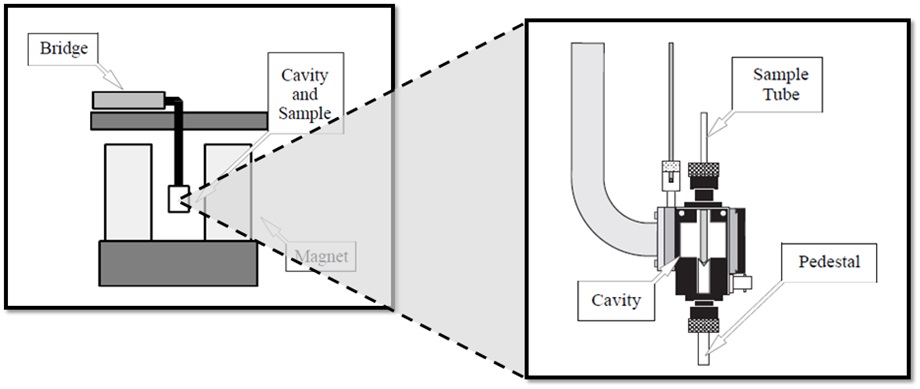
To test ferromagnetism in CuGa1-xMnxTe2 ferromagnetic resonance has been employed. The ferromagnetic resonance field was measured as a function of temperature and Mn concentration, in an E-band VARIAN spectrometer, employing a homemade cylindrical cavity with Q factor of the order of 2000, working in TE100 mode. The magnetic field is supplied by an electromagnet mounted onto a 0-360 degrees base that allowed us to rotate the sample with respect to the direction of the applied field. With this we were able to study the angular symmetry of the FMR signal. The magnetic field was applied parallel to the plane of the sample. All spectra were taken at 9.35 GHz cavity, and in the temperature range 90 K<T<300 K. The temperature was calibrated using a carbon-glass thermometer. The FMR measurements were performed at the Condensed Matter Lab., IVIC, Caracas, Venezuela. The details of the FMR spectrometer used in this work are shown in Figure 2.
(a)
(b)
Figure 2. Experimental set-up employed in the FMR measurements: a) FMR spectrometer; b) details of the sample cavity. (Figure credits: Condensed Matter Lab., IVIC, Caracas, Venezuela.)
Phenomenological approach
In this section I present the main aspects of the model used to explain the experimental results of this work. In general, the description of magnetism in matter must consider two regimes: a) a dynamic regime in which the magnetic moments relax in time, and b) a saturated stated, governed by the precession of the magnetization around an effective magnetic field. Although ferromagnetism is a purely quantum mechanical property of matter, a macroscopic description is somehow useful considering the resonance condition [9],
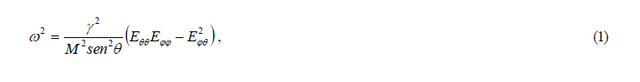
where ω is the microwave frequency, M is the saturation magnetization, γ=1.4 gMn (GHz/KOe) is the gyromagnetic ratio for Mn, and Eθθ, Eφφ, Eθφ are the second derivatives of the magnetic free energy with respect to the equilibrium positions of the magnetization. If our system is considered as a collection of magnetically oriented grains or particles, then we can use the free-energy
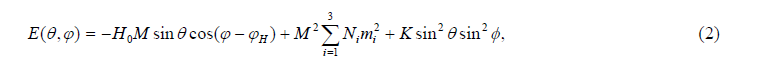
where the first term is the Zeeman energy at a magnetic field H0, Ni are the demagnetizing factors of the material, K is the anisotropy constant, and mi the director cosines of the magnetization M in spherical coordinates, as in Figure 3. The angular derivatives of the free energy are now calculated for ellipsoids of rotation (N1=N2=N⊥;N3=N//), with magnetization M=μ0/V0, being μ0 and V0, the particle moment and particle volume, respectively. The field is applied in the xy-plane parallel to the plane of the sample (θH=π/2), with the magnetization along the uniaxial axis. At resonance (H0=HR), the magnetization follows approximately the external field with equilibrium angles θ0=π/2, φ0=φH, so the resonance condition is,
where Meff=|N//− N⊥|M an effective magnetization, HK is the uniaxial field defined as 2K/M, and ε=±1 represent an ellipsoid with the shape of an spheroid (+) or an ovoid (-). Equation (3) must be solved numerically for every position of magnetic field to determine the three parameters Meff, HK and γ. However, when the condition Meff>>HK is fulfilled, the FMR satisfy the expression,
The detailed calculations of the ferromagnetic resonance equations and their applications can be found in my Notes on Magnetism: Ferromagnetic Resonance and Applications:
Figure 3. Geometry used in the calculations of the ferromagnetic resonance field. (Figure credits: the Author)
Results and analysis
In this section, I present the main results of this work. First of all, it is a mandatory task in any spectroscopic experiment to analyze the raw spectra. Since this is a short report, only the resonance spectra of the sample CuGa0.75Mn0.25Te2 are shown in Figure 4, for several temperatures and for some field orientation. The FMR absorption is in general characterized by: (a) a sharp low-field peak below 235 K, and (b) a weak high-field signal above 235 K. No signal was detected for temperatures <90 K. All signals showed asymmetrical lines-shapes which reflect some electronic properties of these alloys.
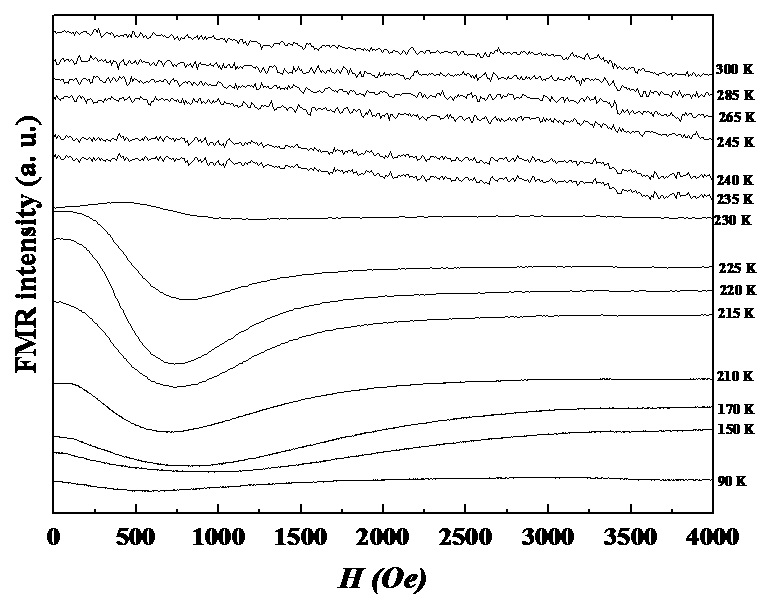
Figure 4. FMR spectra of the sample with x=0.25 for all temperatures. Observe the weak peak appearing at T≈235 K. (Figure credits: the Author)
By rotating the plane of the sample with respect to the field direction we have also studied the anisotropic properties of CuGa1-xMnxTe2. If there is any anisotropy field, then some symmetry must be observed. In Fig. 5 we present the angular dependence of the low-field peak recorded at T~220 K, and for several Mn concentrations. In the sample with x=0.05 the resonance field shows no clear evidence of any anisotropy, however, an uniaxial symmetry is observed for Mn content x=0.10. The solid curves in Fig. 5 are calculated using Equation (4), with the parameters listed in Table I. Fairly good agreement between theory and experimental data is obtained assuming ovoid particles (ε= -1) with gMn or the order of 3.5. As compared with the g-value of atomic Mn of 2.5, this means that in average, there is a strong orbital contribution to the total angular momentum of Mn. Observe from Table I that both, HK and MAs I always have been said to my students: “there is no complete magnetic characterization of matter without a temperature study”. The temperature behavior of the low- and high-field resonances is presented in Fig. 6, for all values of x. The measurements were taken at the position of maximum resonance (φH=π/2). The solid curve was calculated using the resonance field given in Equation (3), with the temperature dependences, increase with Mn concentration. In contrast, no angular variation was observed for the high-field peak, and it is detected in between the field range from 3440 Oe to 3670 Oe, depending on the Mn concentration. This indicates the absence of local uniaxial anisotropy field in this range of magnetic fields.
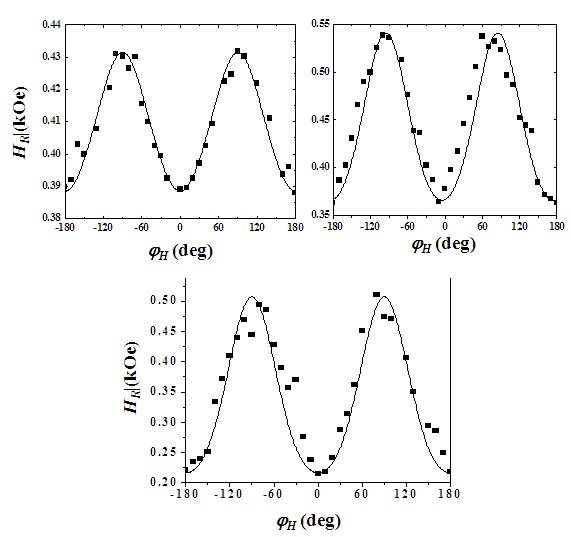
Figure 5. Angular dependence of the low-field resonance peak for several Mn concentrations. The measurements were taken at T ~220 K. (Figure credits: the Author)
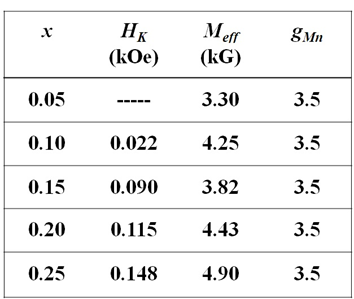
Table 1. Magnetic parameters of CuGa1-xMnxTe2 obtained after the calculations of the FMR field with Equation (4). (Figure credits: the Author)
As I always have been said to my students: “there is no complete magnetic characterization of matter without a temperature study”. The temperature behavior of the low- and high-field resonances is presented in Fig. 6, for all values of x. The measurements were taken at the position of maximum resonance (φH=π/2). The solid curve was calculated using the resonance field given in Equation (3), with the temperature dependences [10]
,
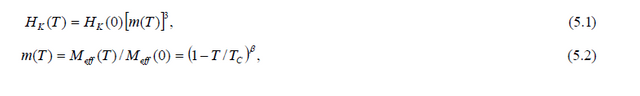
being TC the Curie-Weiss temperature, and β a critical exponent of the order of about 0.40. For HK(0), M(0) and g, we have obtained the values 0.10 kOe, 6.6 kG and 3.5, respectively. The best value for the Curie-Weiss temperature, TC, was of the order of 235 K, which is very close to that reported in the literature for these alloys, TC = 240 K [11]. The dashed lines correspond to the resonance condition for a paramagnet (HR=ω/γ) with g-factor varying from 1.88 to 1.98, in the whole range of x. These findings are in contrast with previous works suggesting a ferromagnetic-to-superparamagnetic transition at TC, in CuGa1-xMnxTe2 [4, 5]. The behavior of the g-factor is also of interest for DMS-based spintronic devices in which relatively high effective g-factors are required, and could well bear more detailed experimental attention in ferromagnetic semiconductors.
Also of interest is the fact that in the sample with x=0.25 the value of HR a small shift to lower fields is observed at temperatures lowered than 130 K (see inset in Fig. 6). This is a second-order transition that could be related to a continuous increase in the effective magnetization of the Mn grains, probably due to an indirect exchange interaction of the RKKY type [12]. This phenomenon still to be unexplained and more theoretical and experimental work on this subject are needed.
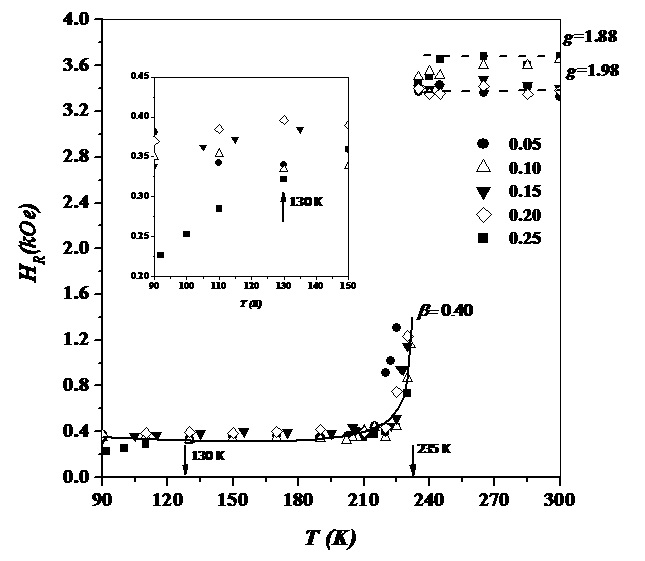
Figure 6. Temperature dependence of the ferromagnetic resonance field for all samples. Measurements were taken with the magnetic field applied in the vicinity of maximum resonance (φH=π/2). (Figure credits: the Author)
Final remarks
I have presented experimental and phenomenological results that suggest the presence of a ferromagnetic ordering in the DMS CuGa1-xMnxTe2. This ferromagnetism is not observed in other members of the family of semiconductors CuGaMn-VI2, and is due to the formation of ferromagnetically oriented uniaxial Mn grains, just when the Mn concentration x = 0.10. At these Mn concentrations, a FM-PM phase transition is observed at a Curie-Weiss obeying of about 235 K. This behavior can be explained with the saturation magnetization obeying the critical law M(T)/M(0)=(1−T/ TC)0.40. In highly doped CuGaTe2 (x>0.25) a second-order low-temperature FM transition is present, which is related to a thermal increase of the effective magnetization due to a triggering of an indirect exchange interaction of the RKKY type.
Several questions arise from this work: (a) the origin of the transition at TC); (b) the effect of Mn concentration on the magnetic ordering; (c) the relation between the anisotropy field and the Mn concentration; (d) the real dependence of the particle magnetization with respect to temperature; (e) the origin of the low-temperature transition in highly doped materials.
References
1. J. Furdyna, J. Kossut (Eds.), Diluted Magnetic Semiconductors, Semiconductors and Semimetals, Vol. 25, Academic Press, Boston, 1986.
2. A. J. Freeman, Yu-Jun Zhao, J., J. Phys. Chem. Solids, 64, 1453 (2003)
3. K. Sato, Materials Science in Semiconductors Processing 6, 335-338 (2003)
4. José R. Fermin, Alexander Nava, Carlos A. Durante-Rincón, Jaime Castro and Pedro J. Silva, J. Magn. Magn. Mater. 327, 79 (2013).
5. V. M. Novotortsev, G. G. Shabunina, L. I. Koroleva, T. G. Aminov, R. V. Demin, S. V. Boichuk, Inorganic Materials, 43, 12 (2007).
6. J. Pérez, P. J. Silva, C. A. Durante-Rincón, J. Primera Ferrer, and J. R. Fermin, J. Magn. Magn. Mater., 320, 2155 (2008).
7. Stoner, E.C. and Wohlfarth, E. P., Philosophical Transactions of the Royal Society A. 240, 599–642 (1948).
8. Michael Farle, Rep. Prog. Phys. 61, 755 (1998)
9. H. Suhl, Phys. Rev. 97, 555 (1955).
10. Callen, H-B and Callen, E, J. Phys. Chem. Solids 27, 1271 (1966).
11. W. L. Lee, T. Pray, K. A. Regan, R. J. Cava, R. N. Bhatt, N. P. Ong, APS March Meeting U16.4, Indianapolis, USA (2002).
12. T. Dietl, H. Ono, J. Cibert, D. Ferrand, Science, 287, 1019 (2000).
Hola. Me trajistes gratos recuerdos con las fotos del laboratorio. Cuando eramos jovenes y felices y no lo sabiamos. Muy buen trabajo
A gueno. pa q sepáis...
Saludos @jfermin70. Excelente trabajo. Jovenes por siempre.
Jóvens x sempre...
my head hurts a bit trying to skim through technical ferromagnetic explanations to understand this post, admittedly didn't get too far. Sounds interesting, so basically approaching new insight into properties and influence of Mn possibly somewhat related to how it works in Heusler alloy ?
Your question is very interesting...a Heusler alloy is a very intriguing compound from a point a view of a FMR experiment. This is because these compounds may exhibit different magnetic phases depending on temperature... For instance, I preferred magnetization measurements before FMR on a Heusler alloy...
Excellent post my collegue and friend @jfermin70. Articles of this quality make science reach more people. Thanks for sharing this information. Regards.
tankiu...friend...