A Discussion About Climate Change - Part 3: Proxies
- Has our planet experienced prior climatic variations?
- What has caused these variations?
- How can we know this?
- Does human activity influence global conditions?
- What do models predict for the future of Earth's climate?
You may have preconceived notions about some of these questions, or opinions about what is actually happening. My intention is not to overturn your beliefs, but rather provide an objective overview of the best available proxy data.
Prior Variations
In the first and second parts of this series of articles on climate change, the concepts of Milankovitch Cycles and greenhouse gasses were introduced. The first two questions posed in this article are discussed at length in these posts. This article will focus on the third question, while a future post will be necessary to address the final two questions. I will provide a summary of the first two articles as a refresher: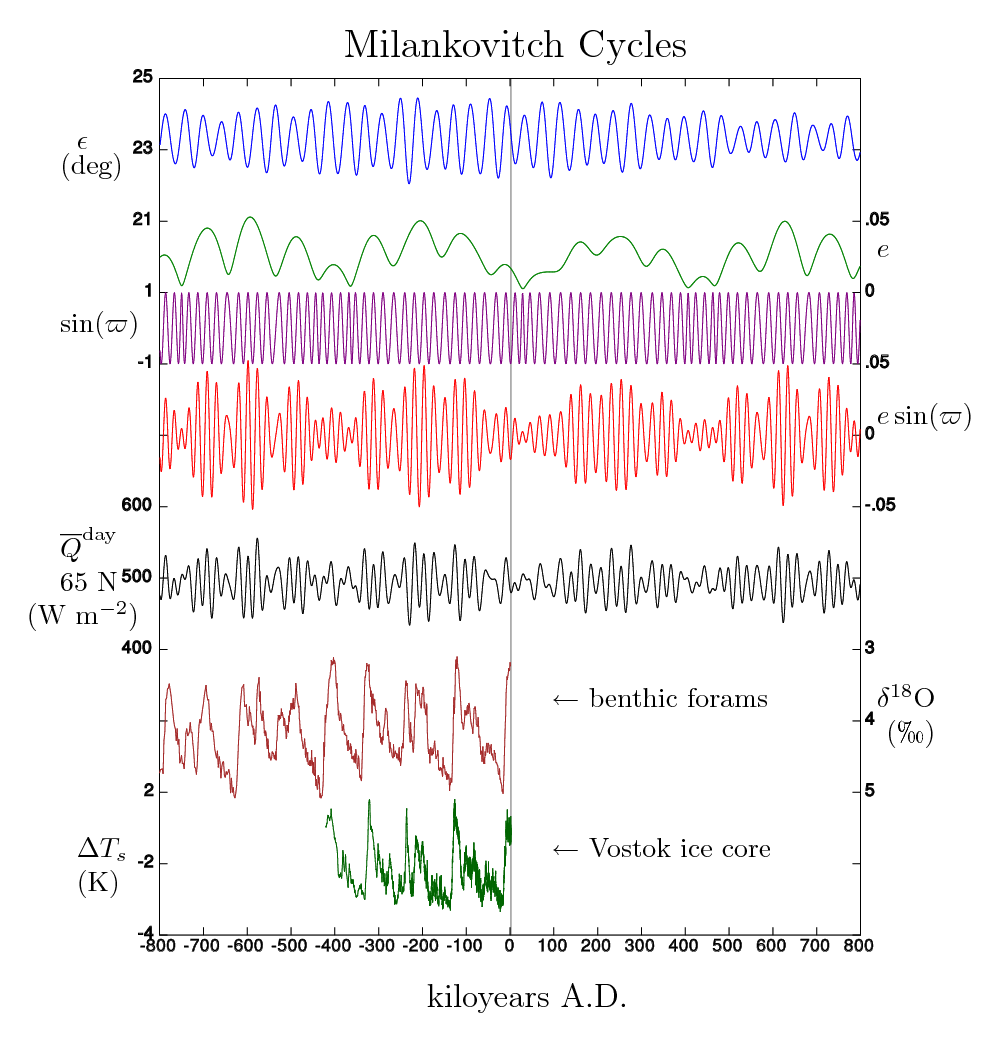 Source | A look at some of the Milankovitch Cycles through the past and projected into the future. Click picture for larger resolution!
The composition of the atmosphere is another factor with a strong influence on the climate of our planet. Greenhouse gasses like carbon dioxide (CO2), ozone, methane, and water vapor trap solar radiation, contributing to warming trends. Paradoxically, as global temperatures rise, the increase of water vapor in the atmosphere forms clouds that reflect sunlight and encourage cooling. Similarly, the dust clouds emitted by volcanic eruptions and other natural disasters block sunlight from reaching the surface. As the planet cools and becomes covered in ice and snow, this bright white surface reflects most of the incoming solar radiation and perpetuates the cooling trend. The complex interactions of these different factors and cycles are the ultimate cause of historical climate change.
Data Sources
A skeptical person (a good scientist) might wonder how we can know about what the climate of the planet was like long ago. There is no direct way to know, but there are several proxies that can be used as indicators. When proxies collected in different parts of the world align and agree on the timing and relative severity of climatic extremes, these correlated events are hard to argue away as mere coincidence.
Ice Cores
 Simple animation showing snowfall (white) accumulating and gradually being compacted in to ice (light blue).
Drilling
To examine the atmosphere of the past, scientists and drillers extract ice cores from different ice masses in the Arctic, Antarctic, and glaciated mountainous regions. The center of the ice mass is often chosen for coring due to the lack of ablation and glacial motion in these areas. Small sections of these cores are processed by melting and crushing them in a vacuum chamber so the trace amounts of gas can be isolated and analyzed.
Animation showing the global spatial variation of ice core drill sites with three different views: What year the drilling started, the total depth of the core, and both the year and depth (shown as circle diameter). GIS visualization created using data extracted from this page.
Antarctica
More than 200 ice cores have been collected in Antarctica, most notably at a station known as Vostok. Drilling here started in the 1970s and the deepest borehole (finished in 2007) reaches 3,661 meters. The rate of accumulation dictates the thickness of snow layers, meaning the deepest borehole does not necessarily represent the greatest amount of time. An antarctic site known as Dome C was drilled in 2006 and reached bedrock. The borehole is 2,760 meters deep and represents approximately 800,000 years of accumulation! A new site in Antarctica claims to extract records as old as 2.7 million years, though the methods used have a greater temporal uncertainty.Greenland
The Greenland ice sheet is a mass of ice that covers most (80%) of Greenland's surface. Since the 1970s, nearly 150 ice cores have been successfully recovered in Greenland, including one from NorthGRIP that reached to 3,080 meters. The rate of accumulation is much greater here than in Antarctica, meaning that only 120,000 years of proxy data was extracted. Although less time is preserved in the Greenland cores, the resolution of collected data is superior. Source | Greenland is beautiful, but not too warm.
Other Ice
Ice cores have been collected in mountainous regions throughout the world, though these cores are not as deep as those collected in polar regions. Active alpine glaciers can be used as a regional source of climatic records stretching back to the start of the last glaciation (~100,000 years). More importantly, these ice records preserve the regional microclimates that are missed when only considering cores from Antarctica and Greenland.Sediment
Sediment is constantly accumulating and lithifying at the bottom of lakes and oceans, similar to how snow accumulates and compacts into ice. Because these are very low-energy environments, the sediment remains largely undisturbed after deposition and can serve as an informative proxy. These layers of ocean sediment trap dust, ash, pollen, fossils, and other indicators that can be used to reconstruct the climatic history of our planet.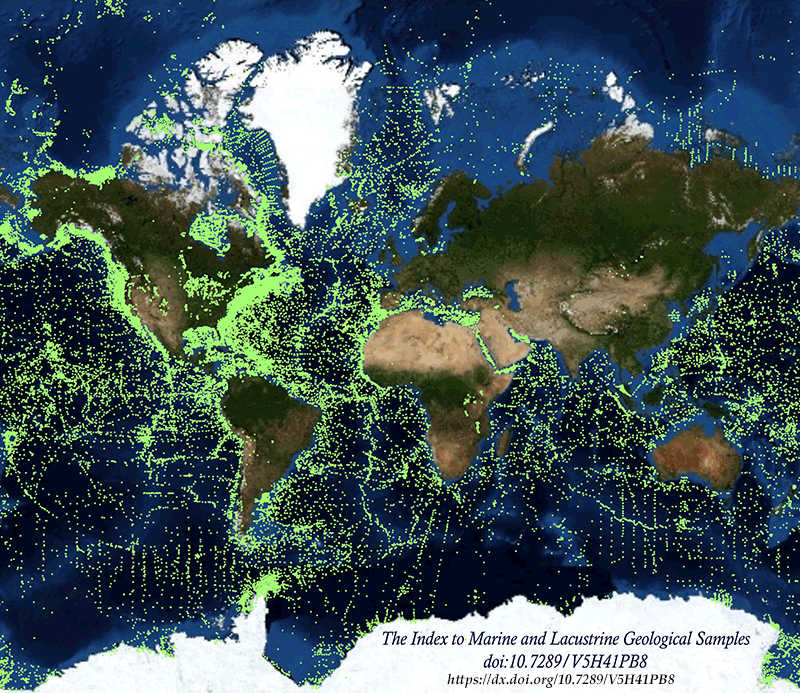 Source | Overview map showing the locations of ocean and lake sediment collection points (light green).
An extensive amount of ocean and lake sampling has been done across all parts of the world, as shown in the map above. This shallow sampling is important for detecting changes in the recent past, but to really look back in time a deeper section of sediment is necessary. Several international research teams participate in a deep ocean drilling initiative that has collected over 1,000 deep ocean sediment cores. The locations of these drilling sites are shown in the map below.
Source | A map showing locations of deep ocean sediment drilling.
Indicators
As with ice cores, isotopes are accurate indicators that can be found throughout sediment. Ocean mud contains a significant amount of organic matter and carbonate fossils, and these carbon isotopes can be used to approximate changes in the activity of photosynthetic organisms brought on by fluctuations in temperature, incoming solar radiation, and water chemistry.
 Source | A bee basking in lush flower pollen suggests that we are no longer in a glacial period.
In addition to examining the extracted core, boreholes drilled in sediment and bedrock can be examined through a process known as gamma ray logging. Differences in the density and composition of sediment are determined based on the amount of gamma rays emitted and absorbed by each layer. The same isotope proxies discussed above can be used with sedimentary rock, allowing proxies to offer a view of what temperatures were like thousands, millions, even hundreds-of-millions of years into the past. When proxy data of any type is used to extrapolate information regarding the climate of the past, it is referred to as a paleothermometer.
Past Trends
The real test for the validity of proxy data is the comparison of data from different locations. Cores that have been analyzed and made public indicate very similar trends. Levels of CO2 and other greenhouse gasses have a clear relationship with temperature, shown in the following graph of reconstructed data from a core drilled at Vostok.
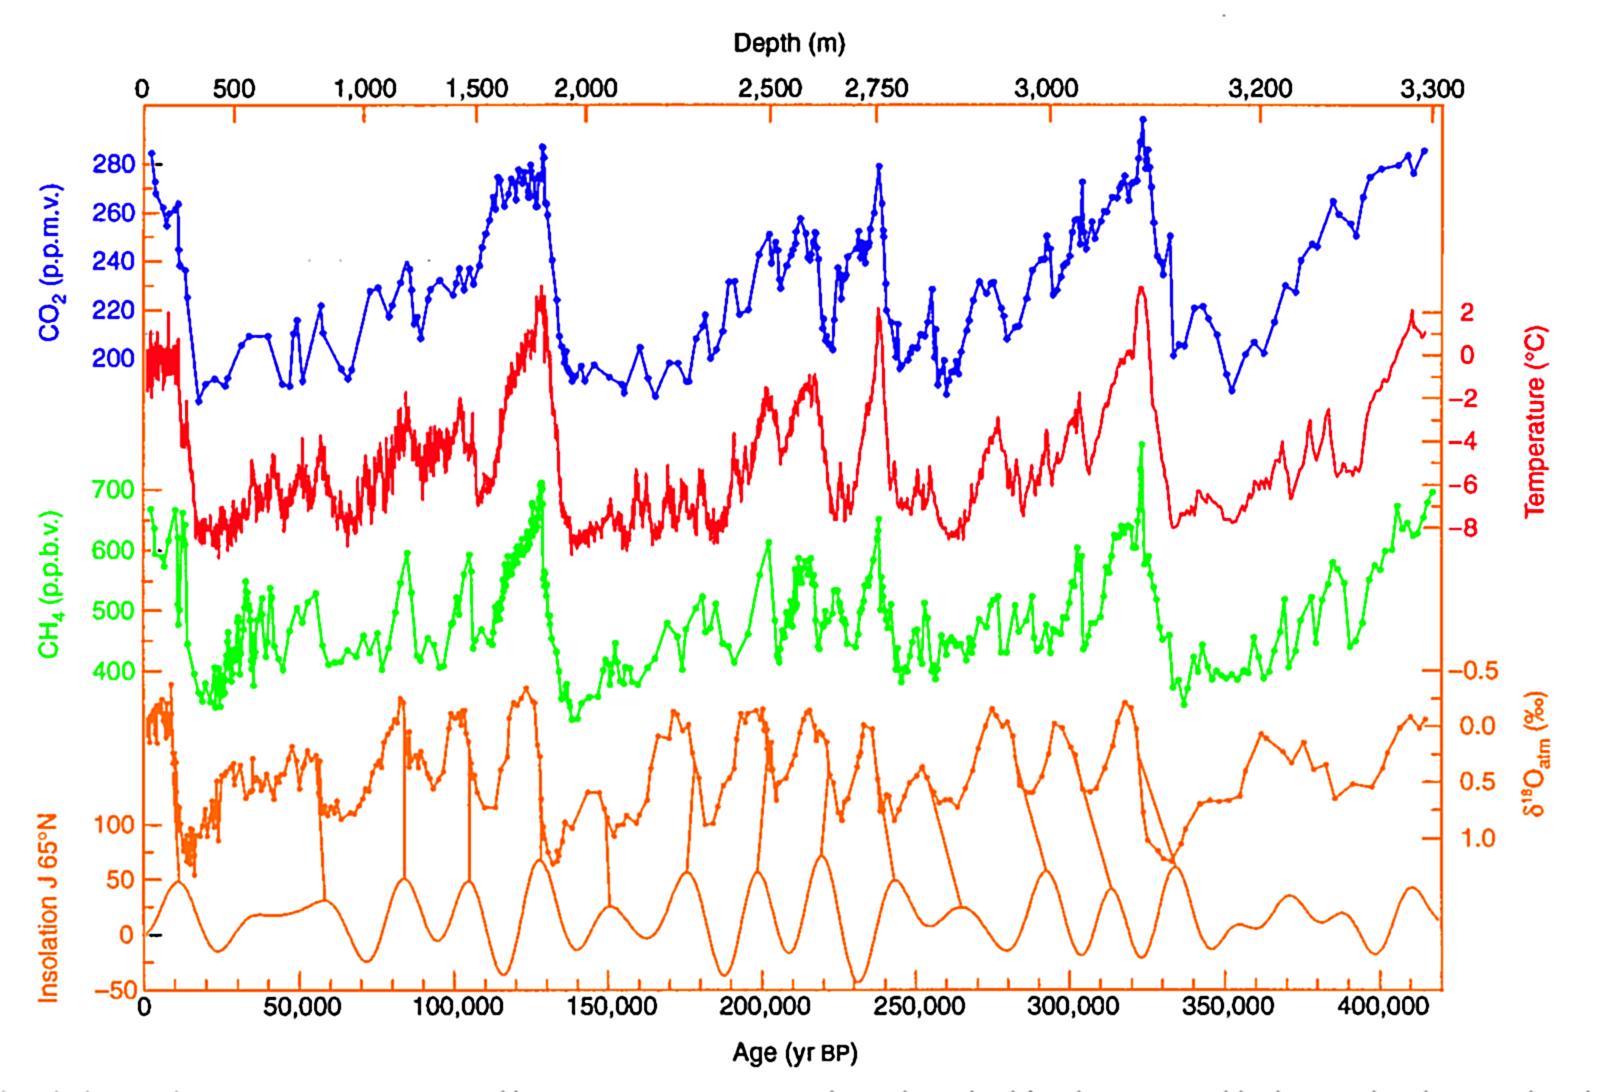 Source | Graph showing the levels of greenhouse gasses (Carbon Dioxide CO2, Methane CH4) and other climate proxy data as it relates to age and depth from a Vostok core.
The peaks and troughs of each indicator and proxy coincide with minimal variance, implying that global temperature and greenhouse gas levels are directly correlated. The bottom insolation graph reflects the impact of the Milankovitch Cycles, and this influence is echoed throughout the other proxies.
A brief look at this data reveals that the climate of our planet has gone through cycles of warming and cooling five separate times in the last 0.42 million years. Global temperatures during this period were as many as eight degrees (Celsius) cooler and two degrees warmer than they are today. Over this time span, CO2 levels have fluctuated between 180 and 300 parts per million. Historically, the planet has somewhat gradually cooled in to glacial periods, and rapidly (thousands of years) transitioned from glacial periods into warmer temperatures.
Rather than trying to describe and summarize the masses of core data and the numerous studies analyzing them, the most recent and accurate temperature data is conveniently compiled and summarized in the following figure:
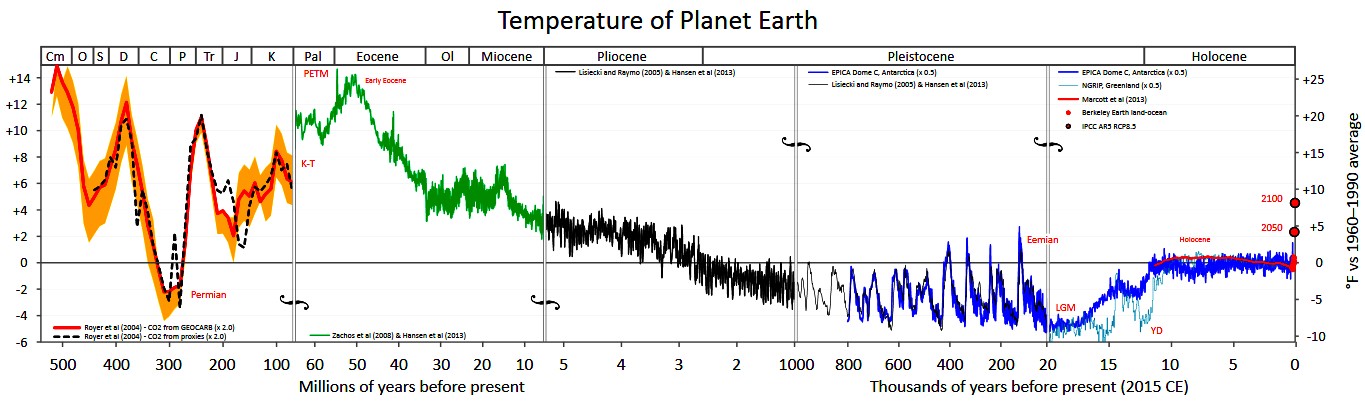
The oldest data is more than 500 million years in age, but the proxy used has a significantly larger uncertainty (shown as the yellow bounds). Regardless of this uncertainty, it is evident that the climate 500 and 400 million years ago was much warmer (about 8 degrees C) than it is today. An ice age occurred around 360 million years ago, followed by a gradual temperature increase interspersed with slight cooling periods.
Temperatures peaked again about 50 million years ago in the Early Eocene, after which Earth experienced a steady and gradual cooling phase. The cycles over the last 1 million years match those depicted in the Vostok graph discussed in the previous section - a slight cooling overall with regular fluctuations between warmer and cooler periods.
The most recent glacial period began about 100,000 years ago, ending with a warming trend that started in the Holocene about 12,000 years ago. During the Holocene, Earth has experienced relatively stable temperatures that have seldom fluctuated more than 1 degree Celsius from the current average temperature.
Recent Trends
To examine how the climate has been changing in the recent past, we need to consider an even finer time scale. Ice cores drilled in areas with high rates of snow accumulation offer a higher temporal resolution of proxy data. One such site is Law Dome in Antarctica.
Carbon Dioxide

Source | Graph of CO2 concentrations over the past 1,000 years extracted from ice cored at Law Dome, Antarctica
The Law Dome core offers close a look at the past millennium of carbon dioxide levels. From year 1,000 AD until about 1760, the levels of carbon dioxide in the atmosphere remained relatively stable (in line with Holocene temperatures). After 1760, there is at first a gradual and then a sudden increase in carbon levels starting in about 1875. This trend has continued at an increased rate to present day.
Temperature

Source | Graph of global temperatures over the past 2,000 years determined based on multiple proxies
The proxies for temperature over the last 2,000 years show more variability than the carbon records, with a warm period from about 1000-1200 AD known as the Medieval Warm Period and a brief cooling spell known as the Little Ice Age from around 1600-1850 AD. Despite this variance, the average trend of temperature is similar to carbon, with relative stability through most of the recent past. Approximately 150-200 years ago, the current period of warming started, aligning with the observed increase in carbon dioxide levels.
Direct Measurements
Proxies are very useful for examining the climate of the past, but for recent data the most precise readings come from direct measurements. These recent data sets offer the best glimpse at the real-time changes occurring in our planet's atmosphere.
Carbon Dioxide

Source | Graph of CO2 concentrations for the past 70 years, measured directly at the Mauna Loa Observatory in Hawaii. The black line represents the average annual value.
The amount of carbon dioxide in the atmosphere has been directly measured for nearly 70 years at the observatory atop the volcanic mountain Mauna Loa. This data set is accurate to 1 part per trillion, and is the world's oldest continuous direct measurement of atmospheric CO2 concentration. Fluctuations in carbon dioxide brought on by seasonal temperature changes are clearly visible in the red data plot. The trend of the black line shows that carbon dioxide levels have steadily increased since they were first measured in 1958. Not only this, but the concave-up inflection of the curve indicates that the rate of carbon dioxide concentration increase is itself increasing. It is now officially higher than 400 ppm, a level which has not been seen in over a million years.
Temperature
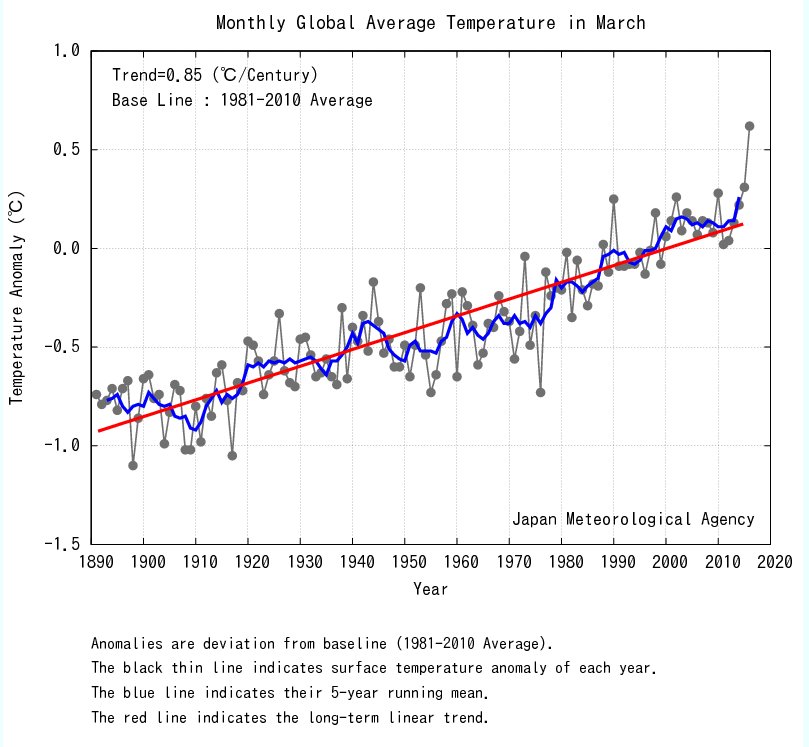 Source | Graph of temperatures in March for the past 125 years, measured directly. Data averaged by the Japan Meteorological Agency
Parting Thoughts
Ice and sediment cores are not the only means by which historical proxy data is gathered. They are the focus of this article because they represent some of the most prevalent and reliable data. The spatial distribution of core samples ensures that the data is representative of all parts of our planet, and the undisturbed sediment and ice cores provide some of the best proxy data available.Many other proxies exist, such as tree growth rings, historical observations, ocean temperatures, the composition of coral reefs, etc. Please feel free to expand the discussion of these and other climate proxies in the comments! There are literally way too many topics to cover them all...
In the next part of this series, we will take a closer look at the data, consider human contributions, and maybe even examine the state of climate modeling and the projected future of our planet!
Another fantastic and comprehensive post on this topic Gra. Lots of good information and reference materials for just how climate scientists obtain (some of the types of) samples allowing them to determine the climate on the planet from many years prior.
Thanks for your support! The field of paleoclimatology is growing faster than I can follow, so hopefully this post will bring in some experts to spur the discussion!
Thanks a lot for this very nice post! I will definitely forward this information to climate deniers I personally know (I am sure all of us at least know one :p ). I am not sure I can make a fully convinced person change his/her mind. We will see.
The main problem, in my opinion, is that data is partly accounted for by deniers, which is what you try to cure with your very objective posts. Thanks for that.
I appreciate the encouragement! Even if this article does not change anyone's mind, hopefully it will cause them rethink their argument!
This may relate to climate change. This may be my memory playing tricks.
Was there not an island west of Australia?
Sorry. It must be a nonexistent island charted in the past like "Sandy Island." It's the only explanation I can find besides some conspiracy theory. Sorry.
My first comment, and I've already made a fool of myself!
Thanks for the comment! If you look back far enough in time, Antarctica used to be to the west of Australia. However, it was part of a supercontinent rather than an island.
Wow, nice! I'm going to look at some old maps on that now. My brain popped when I saw the map in your presentation, and was thrown off. I never said that I love your presentation and attention to detail! Climate changes are getting freakishly scary as of late. I'm glad I came across this.
Climate change is more threatening for countries like Bangladesh,our weather is becoming more and more hostile.future isn't good for us.
You are right, the geography of this area is particularly prone to flooding and extreme weather events. Many low-lying coastal areas will likely become uninhabitable.
Great post. I am glad to see people talking about climate change here on Steemit. Looking at some of the provided graphs, I find it puzzling why scientists will plot temperature anomalies against a changing baseline. I'm sure they have good reasons, but when the Paris climate accord says that we have to limit temperature to no more than 2 degrees C above the preindustrial baseline, but then you have graphs illustrating anomalies over the 1981-2010 average, or the 1960-1990 average, as in the diagrams above, it becomes difficult for the average person to get a picture of where we are ...other than basically that the temperature is going up. Any way, I hope to see more articles like this one.
Thanks for your support! It does seem a little misleading to plot temperatures like this, but I think the primary reason is to show the annual fluctuations about a steady average baseline. It can be confusing to look at the changes over different time scales; too short and it just looks like a steady slow rise, too long and the change seems so sudden and drastic that it must be an anomaly. I think the idea of controlling temperature increase is also confusing, as temperatures would be increasing due to natural Milankovitch cycles even if we didn't exist. Eventually, I hope to do another post in this series looking at the current state of climate modeling and predictions for the future of our planet...stay tuned!
Great job continuing this topic Gra. All together, this is turning into the most objective and comprehensive coverage on climate change I've read.
I will be honored to earn this distinction, thank you! The next part will be the ultimate test of objectivity...
Have you looked at paleoclimate studies using cave formation deposition as proxies? So great stuff there too.
I have not read much about using speleothems as a climate proxy but it seems like a promising technique! The gradual deposition of stalagmites and stalactites and the protected environment of a cave are ideal for preserving isotope records and moisture conditions. Thanks for adding this to the discussion!
Ahoy friend of @wolfcat! :) Will you return to Steemit? If I may ask, what inspires your absence? You have created some of the most high quality posts I have seen here. I missed voting on most of your posts, but I'm super impressed by what you've brought to the table. I hope all is well! Cheers, Brandon.
Thank you for your words of encouragement! There are a few reasons behind my hiatus related to the platform itself...I would be glad to discuss this with you at some point. Hopefully I can maintain a semi-regular posting rate moving forward!
Yes, I would love to discuss with you any thoughts you have regarding the platform. We should meet one day in any case. @wolfcat and I will return to Minnesota on the 14th. :) Cheers, b
This is clear and objective, an unflinching scientific view of what's happening in the world. Just the kind of analysis we need to cut through the political rhetoric. Thanks.
Thank you for the praise!
The earth is a gift, we have a responsibility of taking good care of it.