Appendix A (see previous blog post)
The following is Appendix A from the work, Functionalized Cellulose Nanocrystal Nanocomposite
Membranes with Controlled Interfacial Transport for
Improved Reverse Osmosis Performance, my research article, which I've published on the blockchain. For more information on the motivation behind sharing this information, read this blog post.
To read the main research article, click here.
Appendix A
A.1 Thin-Film Nanocomposite Performance
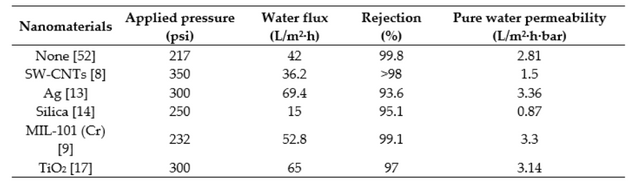
Table A1. Comparison of TFN membrane performances in recent literature. Note: All studies were performed using a feed solution of 2000 ppm NaCl, with the exception of the study with no nanoparticles, which used 1500 ppm NaCl.
A.2. TEMPO Oxidation of Cellulose Nanocrystals
As-received cellulose nanocrystals were oxidized via the following procedure: 100 g of 11.8 wt% CNCs were added with 674 mL of DI water, 24 mL were used to clean weight dish and added by transfer pipette while 650 mL were added by graduated cylinder; 0.3255 mg TEMPO free radical and 3.5635 g NaBr were added to a vessel followed by 200 mL DI water (Sybron Barnstead P/N16508) by graduated cylinder. NaBr solution was added to cellulose nanocrystal solution. Approximately 54.7 mL of NaClO solution was measured by graduated cylinder and slowly added to CNC solution in large Büchner flask while it was stirring. Two-hundred mL of NaOH solution was produced using 4.0665 g of NaOH and a difference in volume of water making 0.5 M NaOH solution. Using NaOH solution, pH was adjusted to 10, measured with a pH probe (Fisher Scientific Orion Star A215), and kept constant for three hours adding by NaOH dropwise. After 3 h, 40 mL of ethanol was added by graduated cylinder after pH was kept constant for 3 h. The TOCN solutions were placed in dialysis tubing, and submerged in DI water. The water was changed several times over the next few days. When the resistivity of the TEMPO CNC bath was 16.53 MΩ·cm. The CNCs were found be in a concentration of ~5.5 mg/mL.
A.3. Conductometric Titration of TOCNs
In order to determine the surface –COOH group concentration on the TOCNs, a conductometric titration was performed using a Fisher Scientific Orion Star A215 conductivity probe; 9.1 mL of the 5.5 mg/mL TOCN stock solution was combined with 0.2 mL of 0.5 M hydrochloric acid, 5 mL of a 0.01 M potassium chloride solution, and 15.7 mL of deionized water. A solution of 0.05 M NaOH was added dropwise to the TOCN-acid solution, and the volume of NaOH solution added (µL) and conductivity readings (µS/cm) were recorded. When the conductivity returned to near its original value at the beginning of the titration, the process was stopped. The procedure was repeated, and the resulting conductivities were plotted against the volume of NaOH solution added to generate Figures A1 and A2:
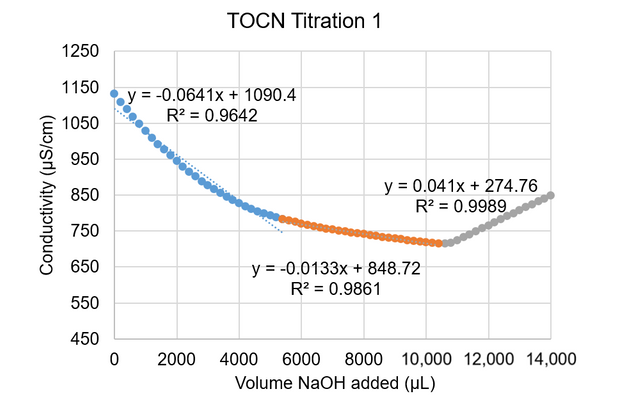
Figure A1. Conductivity vs. volume NaOH added for the first TOCN titration
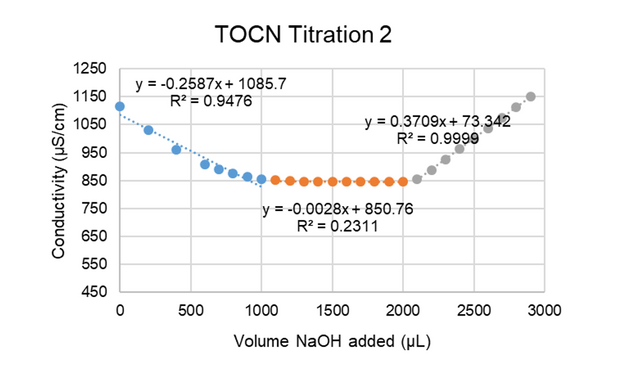
Figure A2. Conductivity vs. volume NaOH added for the second TOCN titration.
Equations were generated to fit each region of the curves, as indicated in Figures A1 and A2 by the blue, orange, and gray colored regions. Intersection points were found between the lines to establish the volume at which the orange region began (this region represents the volume of NaOH needed to titrate the –COOH groups present on the TOCNs). This volume was then used in Equation (A1) to calculate the approximate –COOH end group density on the TOCNs:
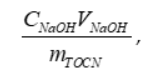 (A1)
(A1)
where is the concentration of the NaOH solution (M), is the volume of NaOH needed to titrate the –COOH groups present in the TOCN solution (orange regions on the curves in Figures 2 and 3), and is the total mass of TOCNs present in the solution in grams. The values for TOCN surface density were determined to be 1.16 mmol/g cellulose for both titrations, which is comparable to literature results [39–41].
A.4. TEM Characterization of TOCNs
Previously developed TEM techniques [45] were used to characterize the TOCNs used in this study. The TOCNs were diluted to 0.1 mg/mL then added a drop to a transmission electron microscopy (TEM) grid (Pelco® 200 Mesh copper coated silicon monoxide) by transfer pipette then adding 1 drop of Nanovan© stain for thirty seconds and sheeting off excess with a water dunk. The sample was then allowed to dry at room temperature, and characterized using a JEOL 2100 TEM. Images were taken slightly out of focus to enhance contrast. Length and width of the TOCNs were determined to be approximately 101 ± 8 nm and 7 ± 1 nm, respectively, by processing the images presented in Figure 1 with Fiji [38].
A.5. AFM Root Mean Square Roughness
The RMS roughness data were collected from AFM images of each membrane fabricated via the dispersion method at each loading level. The results are displayed in Figure A3.
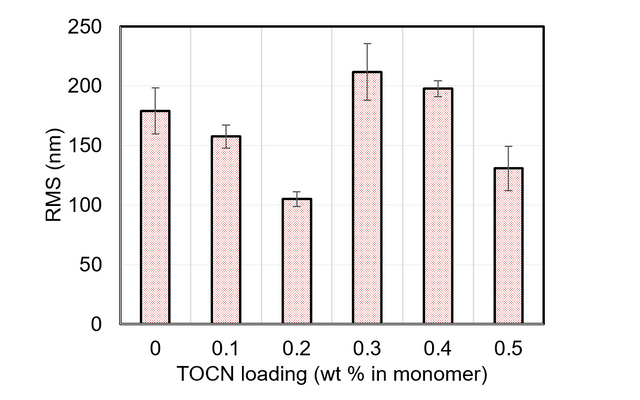
Figure A3. RMS roughness data obtained from AFM scans of TFN membranes with various TOCN loading amounts.
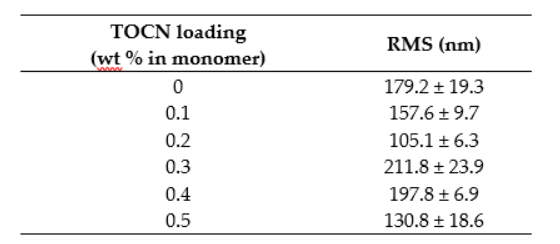
These data are provided in numerical form in Table A2.
Table A2. Numerical RMS roughness values for membranes fabricated with TOCNs via the dispersion method.
The RMS roughness data were also obtained for membranes fabricated via the vacuum filtration method. Figure A4 shows these results.
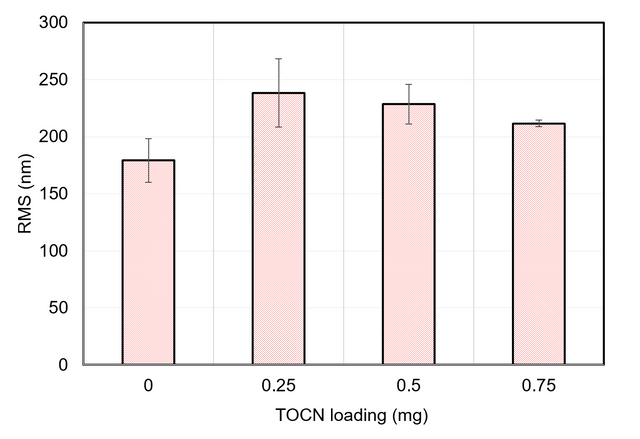
Figure A4. RMS roughness data from AFM scans of membranes fabricated with TOCNs via the vacuum filtration method.
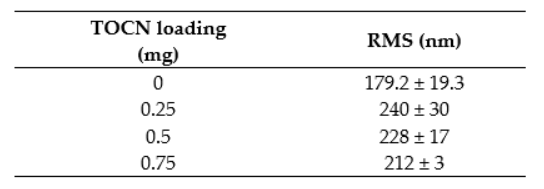
Table A3 displays these as numerical results.
Table A3. Numerical RMS roughness values for membranes fabricated with TOCNs via the dispersion method.
A.6. AFM Phase Images
Figure A5 displays the phase retrace images of the scans in Figures 7 and 8.
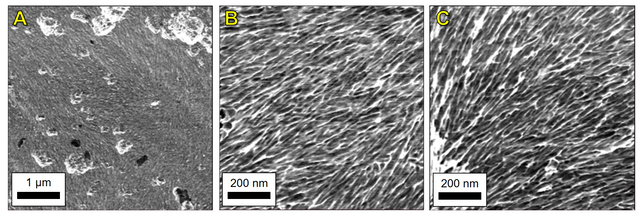
Figure A5. AFM phase retrace images of (A) 0.5 mg TOCN at 5 µm scan size, (B) 0.5 mg TOCN at 1 µm scan size, and (C) 0.75 mg TOCN at 1 µm scan size. These phase images correspond with the height retrace images presented in Figure 7, Figure 8a, and Figure 8b, respectively.
A.7. Contact Angle Goniometry
Contact angle goniometry was used to evaluate the surface hydrophobicity of selected membranes fabricated during this study. A DOW SW30XLE commercial TFC membrane was also analyzed for comparison purposes. One square centimeter areas were cut from the desired membrane and fastened to glass slides. Deionized water droplets approximately 25 µL in volume were dropped onto each surface, and images were taken via the goniometer (CAM 200, KSV Instruments, Ltd., Helsinki, Finland) after one minute of droplet exposure. Measurements were obtained from at least three locations across each membrane. The left and right contact angles were averaged to obtain the final values. The results of these measurements are presented in Figures A6 and A7.
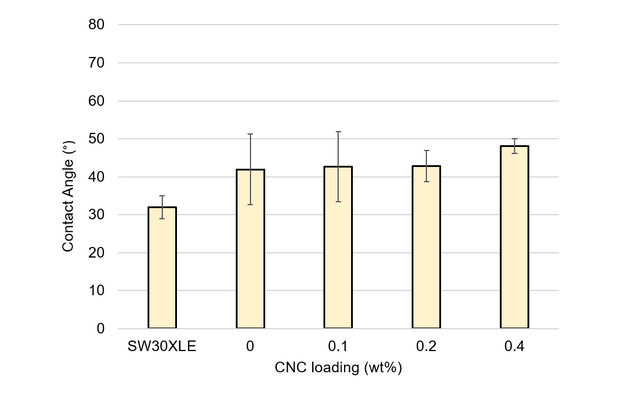
Figure A6. Contact angle measurements for TFN membranes with loading levels of unmodified CNC between 0 and 0.4 wt%. For comparison, measurements from a DOW SW30XLE industrial membrane are included.
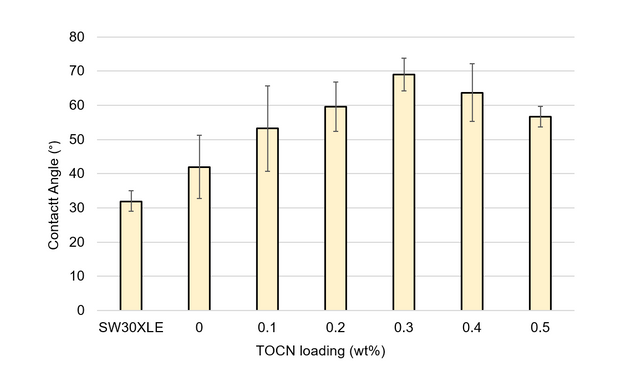
Figure A7. Contact angle measurements for TFN membranes with TOCN loading levels from 0 to 0.5 wt%. For comparison, measurements from a DOW SW30XLE industrial membrane are included.
Congratulations @ethandsmith! You have completed the following achievement on the Steem blockchain and have been rewarded with new badge(s) :
Click here to view your Board
If you no longer want to receive notifications, reply to this comment with the word
STOPTo support your work, I also upvoted your post!
@ethandsmith You have received a 100% upvote from @botreporter because this post did not use any bidbots and you have not used bidbots in the last 30 days!
Upvoting this comment will help keep this service running.