Day at work... When you do everything right and the result is completely wrong :(
When you step into the world of science you are prone to believe that everything you read in a scientific journal is simply perfect. It must be, right? After peer review and citations and several years, it must be the whole truth.
Several years later, you learn, in a hard way that presented is not 100% true. There is probably a trick used in the described protocol that you need to figure out yourself because the authors "forgot" to mention everything. You will also probably find out that the concentrations should be 5-10 times lower or higher.
And approximately 5 years later, you can just look at the paper and say - no way that this worked well.
Don't get me wrong, a lot of scientific papers are valid, but there are three "classes" of results:
- Poor Conferences, low-impact journals, "promising results" - in other words, not trust them a single word. Those were made from leftovers
- Classical journals, there you will find the results that are nor wrong, but if your life depends on them - good luck...
- Real contributions, battle-hardened, tested in medicine, space, engineering and industry (not Theranos scam)
Fractals and Images
As you know, fractals are cool looking psychedelic lines, like those tree-like structures:
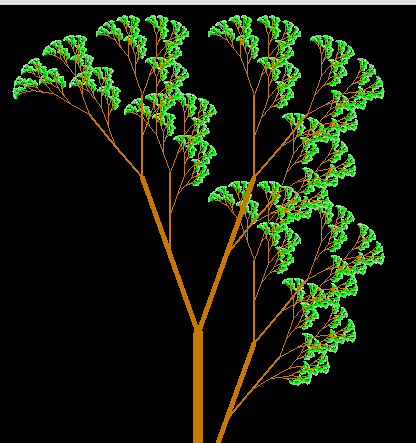
You can also play with fractals if you visit: https://www.cs.unm.edu/~joel/PaperFoldingFractal/paper.html it's ok, it's safe
Now it's time for some real applications.
Imagine that you have a line, of the size X.
If you double the X, the surface becomes X^2 and the volume becomes X^3.
So... What would happen if the one-dimensional fractal lengths are doubled? What would be the spatial content of that fractal? It does not need to be an integer (1 - line, 2 - surface), it can be any number between, 1.57 or 1.73. And that number can tell us some very subtle differences in texture, or in type/ shape of objects.
There is yet another useful property, and it's lacunarity. If you speak some of Roman languages, you will understand that it's some measure of the gaps between the fractals while they fill the space between. And this is what bothers me...
How to...
Recently, I'm in ImageJ mood. Matlab became a bit boring, like a too long relationship.
And there is a handy plugin called FracLac. The colour scheme includes violet and light blue and makes my eyes popping out.
The inspiration came from this article, but my intuition was buzzing.
Let's do some analysis
Freshly baked mitochondria, FracLac... Go!

Db = 1.2893 Mean Lac = 1.5468
And if I select it just a bit differently, because there is no objective rule how to do it...

Db = 1.3998 Mean Lac = 1.4008
Wonderful Method...
Soooo robust and reliable like a cat!
Is it possible to use fractal dimension as a tool for feature extraction / texture analysis? Yes...
However...
Never fully trust the publications, ask a Pro ;)
Nice post. Some questions/comments:
Spatial content of an object is not a uniquely defined. It depends on how you measure spatial content. For example, a one dimensional fractal still has dimension one in terms of topological dimension, but its box counting dimension might be greater than one.
What is Db? (Box counting dimension maybe?)
On a quick glance it seems that the article gives bounds Db and Mean lac to derive properties. So it it is not really a constant but more a very rough guess. If I understand it correctly they say that they use the whole mitochondria for the computation.
It was box-counting... I wanted to try Higuchi, but I didn't have Matlab on that computer: https://revistas.eia.edu.co/index.php/Reveiaenglish/article/download/1206/1128
Db,
Page 12, https://imagej.nih.gov/ij/plugins/fraclac/fraclac-manual.pdf
This approach is very new, and I'm not 100% sure what should I look at...
The first idea was to do some texture analysis, because under the stress / normal conditions, MTH should change their shape from "rod-like" to "cirlce-like".
But it was very bad and not reliable...
Then I've found this MiNa Plug-in, but in reality (poor contrast, overlapped MTH, noise) and it was subjective.
After I've found this tool for Z-stacks but it's also a complete mess with real-life images.
My next attempt was, ok, back to "textures", now with some fractals. In the paper, they obtained an incredibly linear dependence between the "network of MTH" and level of stress. But in reality - it was again subjective.
At the end, I've found that some people used machine learning to distinguish the proportion of 4 different shapes of MTH.
Probably that would be the only solution, to make particles out of them, manually select them into the categories (I have no clear idea how many of them) and after a harsh training - to try...
I'm constantly seeing such hardly reproducible, subjective analyses that are beautifully packed into some statistics so every biologist can say - woooow!!! It's so perect!
Hey @alexs1320
Here's a tip for your valuable feedback! @Utopian-io loves and incentivises informative comments.
Contributing on Utopian
Learn how to contribute on our website.
Want to chat? Join us on Discord https://discord.gg/h52nFrV.
Vote for Utopian Witness!
This reminded me of seeing my grades after the semester finals 🤦!
And about ur analysis, those orange-green trees are nice! The rest passed way over my brain. :D
Seeing the topic, everything done right but the result is wrong... The first thing that struck my mind was chemistry... Knowing the whole processes arrangement doesn't really work, getting the right proportions is also important.
Take titration for example, you have a solution to mix and a set colour you need to meet. An extra drop of an indicator can totally alter your result and mess up the experiment. Even the same experiment can give you several results because of a little miscalculation or something...
Yes, yes...
This post has been voted on by the steemstem curation team and voting trail.
There is more to SteemSTEM than just writing posts, check here for some more tips on being a community member. You can also join our discord here to get to know the rest of the community!
Hi @alexs1320!
Your post was upvoted by utopian.io in cooperation with steemstem - supporting knowledge, innovation and technological advancement on the Steem Blockchain.
Contribute to Open Source with utopian.io
Learn how to contribute on our website and join the new open source economy.
Want to chat? Join the Utopian Community on Discord https://discord.gg/h52nFrV
Congratulations @alexs1320! You have completed the following achievement on the Steem blockchain and have been rewarded with new badge(s) :
Click on the badge to view your Board of Honor.
If you no longer want to receive notifications, reply to this comment with the word
STOP