Gold - This is the bottom! Buy into the sector now!

066/18 Gold – Technical Analysis 5th of July 2018
This is the bottom! Buy into the sector now!
From the last important high at 1,365 USD on April 11th, gold prices moved into a nearly three-month downtrend. Especially since June 14th, gold prices were sliding down 13 trading days in a row without any signifiant countermovement. But due to this strong sell-off in June, gold found a bottom at 1,238 USD last Tuesday. Although my initial price target of 1,250 USD was slightly undercut, the whole down wave was expected and explained in good time.Now that gold has found a first bottom and is working on a trend reversal, it is time to move back into the sector! But let´s take a closer look to undermine this thesis.
Gold Weekly Chart
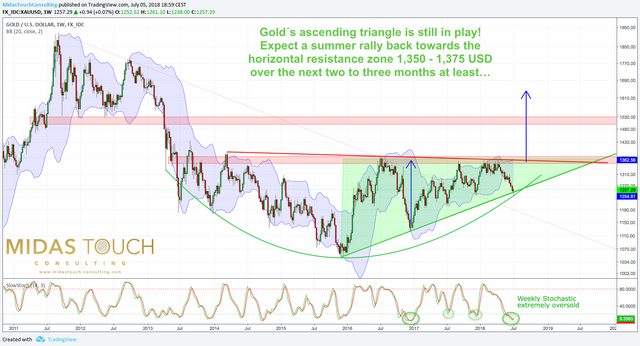 Gold weekly chart from 5th of July 2018. Ascending triangle still in play.
On the weekly chart, gold´s ascending triangle is still play. Only a weekly close clearly below 1,235 USD would have indeed neglected this extremely bullish pattern. While the series of higher lows is still intact, the big questions remains when gold can finally break through the horizontal resistance zone around 1,350 – 1,375 USD.As you can see, the stochastic oscillator is extremely oversold. Similar to December 2016 and December 2016. Both times a strong up-leg with a minimum gain of at least 150 USD followed. To confirm the trend-change the oscillator has to move out of its oversold zone below 30. I expect this to happen within July.
There is no doubt, that this weekly gold chart is a contrarian´s dream.
Gold Daily Chart
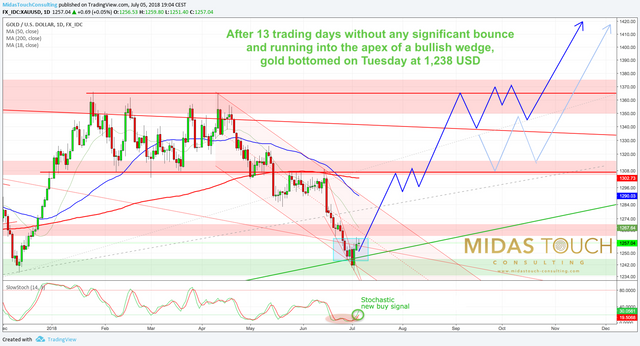
Gold daily chart from 5th of July 2018. Bullish wedge and trend reversal. Stochastic buy signal.
The daily chart captures gold´s movements since the start of this year. In April prices came under pressure and were finally plunging into a steep sell-off over the last four weeks. Although the most important up-trend line around 1,246 USD was undercut by a few bucks, bulls were able to defend this extremely important support. Note as well, that gold had been running into the apex of a steep falling (and therefore bullish) wedge. This wedge is already history as gold broke through it to the upside. As well the stochastic oscillator managed to free itself from the bearish embedded status and flashed a new buy signal!Obviously, the first signals for a trend reversal are already in place. But of course it is still very early and the supposed new uptrend is not yet confirmed in the bigger scheme of things. A move back towards the psychological resistance at 1,300 USD and the 200MA (1,302 USD) would be the finally confirmation.
In sum, the daily chart is now bullish. A recovery towards 1,300 USD over the next couple of weeks is the most likely scenario. Only if gold falls back below 1,245 USD again, the bears are coming back into play.
Gold CoT-Report
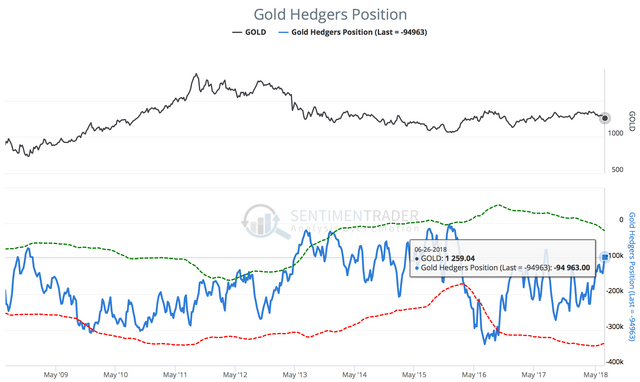 Gold Hedgers Position from June 26th, 2018
The current CoT-Data from the futures market for gold show a significant improvement in regards to the commercial short position. As always, the professionals have taken advantage of the strong price decline in recent weeks and covered a lot of their shorts. As of Tuesday one week ago the cumulative short positions at a gold price of $ 1,259 was “only” 94,963 contracts. This means that the commercial short position has fallen below the 100,000 contract mark for the first time in almost a year. As gold price in the meantime has slipped another 20 USD lower, these numbers should have improved even further.
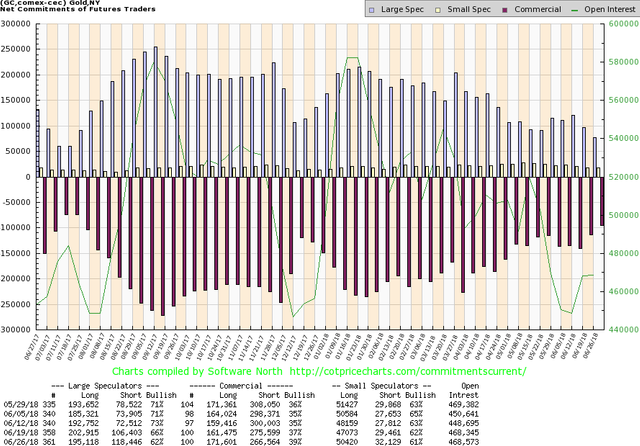
Gold Commitment Of Trades (CoT) as of June 26th, 2018
On the second chart for the CoT-Report you can see that the large speculators (hedge-funds etc.) have been forced to liquidate most of their long contracts. Now they hold a smaller long position than at the last important low in last December. Back then gold posted a strong rally, gaining more than 130 USD in just five weeks…
Overall, the current CoT-Report delivers a clear contrarian buy signal for gold.
Gold Sentiment
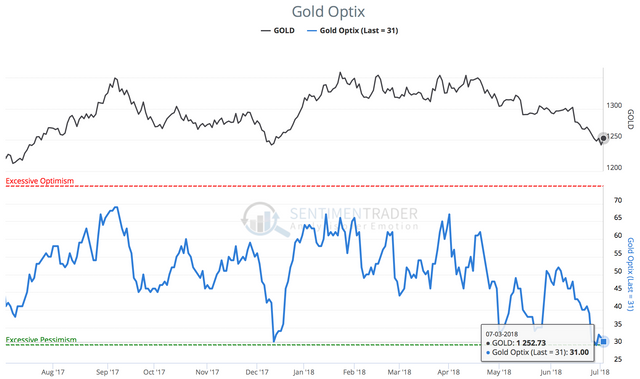
Gold Optimism Index as of July 3rd, 2018
The sentiment towards gold and precious metals is definitely showing high levels of pessimism. No matter whether it was other analysts, investors, readers or partners, not a single one of them was bullish on gold in the last couple of days. Instead price targets around and below $ 1,200 made the round. The data published by Sentimenttrader coincide with my personal perception. The chart clearly shows that sentiment for gold has reached excessive pessimism! Similarly, the mood towards silver and especially towards platinum has been extremely negative too.
Summarized, when everybody is that bearish while the asset has been falling three months in price, you want to become a bull! Therefore sentiment has delivered a clear contrarian buy signal.
Gold Seasonality
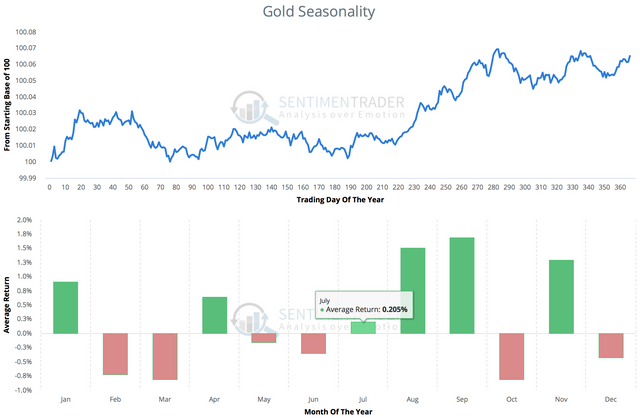
Gold Seasonality, statistical average over the last 40 years
Once again, gold has respected its classic seasonal cycle which is based on statistics over the last 40 years. The strong start into the year, the multi-month sideways period in spring and the sharp sell-off in June all correspond to the seasonal cycle.Of course, one should never determine this seasonal pattern to the exact day. Instead this pattern has to be treated more abstractly and with art and as a helpful tool.For the coming months, seasonality send a big green light for gold and silver. During July and August and often into September strong gold price increases have been observed on a regular basis. The recent sharp sell-off has build the perfect starting position for the long-announced summer rally!
Seasonality now provides a strong buy signal for gold and silver.
Conclusion
As usual gold has tricked almost everyone! After five long months of sideways price action, the expected sell-off has played in full. Now gold is extremely oversold on its daily and weekly chart. The commitment of trades (CoT) are bullish and sentiment is excessively bearish. On top the seasonal cycle has just turned bullish and the ascending triangle is still in play.In my humble opinion, all ingredients for a surprising and massive summer rally are now on the table. I expect a rally towards the multi-year resistance around 1,350 – 1,375 USD within the next tw to three months. Then we have to see in which fashion gold was able to rally to this target. There is a certain chance that gold might even be able to break directly through this extremely strong resistance. Otherwise we will get another pullback within the ascending triangle, which would consume more time until the breakout.Should gold instead move below 1,245 USD again, the bottom thesis has to be questioned. In that case, gold will likely fall towards 1,200 – 1,220 USD before another attempt to change the trade might start.
I am super bullish for gold, silver and the mining stocks and recommend to move with both hands into the sector.
I think you are correct. Super opportunity.
A very sound analysis. Great work!
Congratulations @midastouch! You have completed the following achievement on Steemit and have been rewarded with new badge(s) :
Click on the badge to view your Board of Honor.
If you no longer want to receive notifications, reply to this comment with the word
STOPTo support your work, I also upvoted your post!
Do not miss the last post from @steemitboard:
SteemitBoard World Cup Contest - Brazil vs Belgium
Participate in the SteemitBoard World Cup Contest!
Collect World Cup badges and win free SBD
Support the Gold Sponsors of the contest: @good-karma and @lukestokes