Gold Approaches Critical Support
.jpg)
For the week in sum (6/18/2018 - 6/22/2018), gold finished lower by 0.6% or $8 to close at $1,271 as of the final trade on the New York COMEX futures market on Friday afternoon.
Failed Support Turns to Resistance
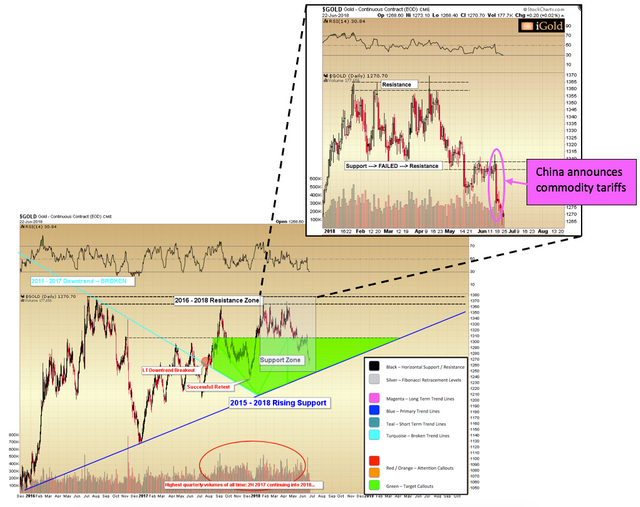
The power of the principle: “failed support turns to resistance” should now be evident by an examination of gold’s decline over the past week. After acting as support from late December through May and then failing on May 15, the $1,302 - $1,307 zone continued to see underwater sellers show up for nearly three straight weeks every time gold attempted to rise above $1,302 again. What was occurring behind the scenes is that long gold traders who bought at or near the former $1,302 - $1,307 support zone then took the next opportunity as gold approached that zone to sell at break-even.

Finally, once enough long holders had liquidated their positions, gold was free to fall with the fundamental spark being broad commodity weakness via China-US tariff wars. The relevant technical action is clear to see on the zoomed-in cutout below (right), with gold failing to eclipse its broken support zone (black) and now falling back on the China commodity tariff announcement.
Gold Approaches Critical Support
When gold broke lower from its $1302 support zone in mid-May, we calculated an initial target of $1,235 for the correction. This target is derived as equal to the amplitude of the 5-month consolidation ($67, see zoomed-in cutout) subtracted from the breakdown point of $1,302.
Fundamentally, this target represents an expectation that long gold contract holders who purchased during the December – May consolidation will be liquidating those positions to avoid losses. Typically the amplitude of the consolidation will correspond with the amplitude of the expected selling pressure. Hence the $1,235 target is calculated.
However, in the case of gold presently an established buying trend comes in at $1,243 and rising each week (royal blue, main chart). This is less than $30 below the close for the week.
Note that this rising support level began with the absolute low of $1,045 in December 2015, which occurred just after the first Federal Reserve interest rate hike of the present cycle. The next significant low occurred nearly a year later, as buyers emerged at a higher level near $1,122 in December 2016. Again, this second higher low occurred in the days following a Federal Reserve rate hike. It takes two points to establish a new trend, and this trend can be extended through the present.
Gold Must Hold Rising Support
It is of utmost importance that gold maintains its posture above this rising support trend for the bullish near-term outlook to remain valid. For the market to stay in a healthy rising technical structure, buyers should show up at increasingly higher levels.
Because this rising support at $1,243 now conflicts with the measured downward target of $1,235, what is setting up is a scenario in which new buyers will need to enter this market over the coming 2-3 months in order to scoop up gold from long-liquidators who are underwater from the December – May consolidation. The appearance – or lack thereof – of new buyers above $1,235 over the coming weeks will tell us much about what to expect for gold over the next several years.
Do we have a rising trend on our hands? If so, the time for gold to prove itself is soon.
Christopher Aaron
Bullion Exchanges Market Analyst
Christopher Aaron has been trading in the commodity and financial markets since the early 2000's. He began his career as an intelligence analyst for the Central Intelligence Agency, where he specialized in the creation and interpretation of pattern-of-life mapping in Afghanistan and Iraq. His strategy of blending behavioral and technical analysis has helped him and his clients to identify both long-term market cycles and short-term opportunities for profit.
This article is provided as a third party analysis and does not necessarily matches views of Bullion Exchanges and should not be considered as financial advice in any way.
Bullion Exchanges is located at 30 West 47th Street in New York City’s Diamond District and is open Monday through Friday 9 A.M. to 5 P.M. or online anytime at BullionExchanges.com