What we can say about Steem users, based on traffic generated to SteemProjects.com after being 3 days on top of trending page.
Last week was for me really crazy :) After months of development I have finally deployed two of my projects, and one of them was on top of Trending Page for a long time...
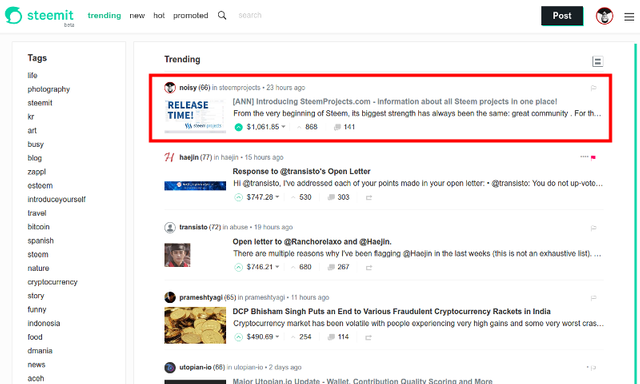
Personal Note: During my 21 months of being active Steemian, after writing 146 articles, that was my second post which ends up on the very top of Trending. Earlier I also had two post which also was quite popular, but didn't reach the top:
| Post Title | Number of Votes | Number of Comments | Reward |
|---|---|---|---|
| We just hacked 11 accounts on Steemit! ~$21 749 in STEEM and SBD is under our control. But we are good guys 😇 So... | 2300 | 579 | $7520.61 |
| [ANN] Introducing SteemProjects.com - information about all Steem projects in one place! | 1995 | 398 | $905.14 |
| How to increase a productivity as a software developer - part I, LiveCoding | 279 | 23 | $4773.19 |
| How I bankrupt my first startup by not understanding the definition of MVP - Minimum Viable Product | 313 | 41 | $1827.89 |
But this time was different...
... because this time I have an opportunity to analyze generated traffic in a more detail way, and everything because of the fact, that last post was about website https://SteemProjects.com/, on which I installed Google Analytics, which collects data anonymously. Basically, I assume, that majority of users during reading or after that decided to visit a website, to check it out.
Since SteemProject started, it was viewed 23k times!
I think this is quite representative data sample, so I assume, that analysis based on such traffic should reflect users, demography, and some other properties of Steem community.
Would you like to learn how much users came to SteemProjects from Steemit.com and how much from Busy.org? Are you curious how much traffic single Tweet of @ned can generate? What about females vs. males? Or maybe you would like to find out what types of applications are the most popular among Steemians? If yes... please read the second part of this post, which was prepared for you by @lukmarcus.
Let's start with something simple, like... how much traffic can generate entry on very top of Trending. The post was there for 2.5 days... what is clearly reflected in numbers.
Number of Users
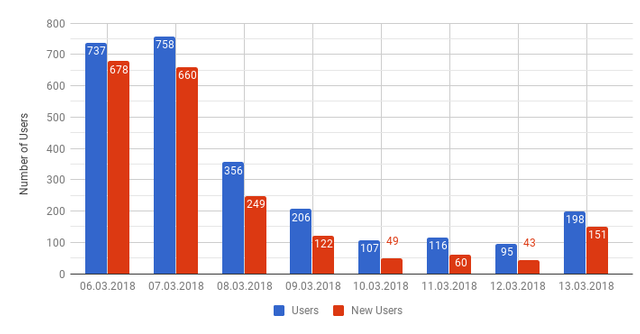
Of course, the biggest traffic was in first days. What is very interesting, traffic from day 1 was almost the same as from 2nd that. We can see this even better when we change day into hours:
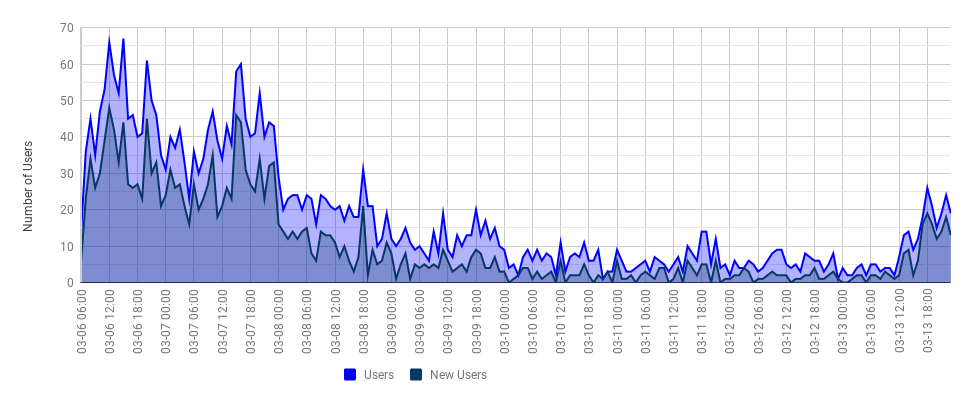
What conclusion can we draw from it? It looks like users of Steem are checking out Trending page every other day. Only some users, check it out every day (the 2nd day was slightly worse). After 2 days, most active users of Steem, was already familiar with this post.
Demographic Statistics
With that amount of data, there are a lot of statistics about users that can be presented. For example, we can look at age and gender of new users:
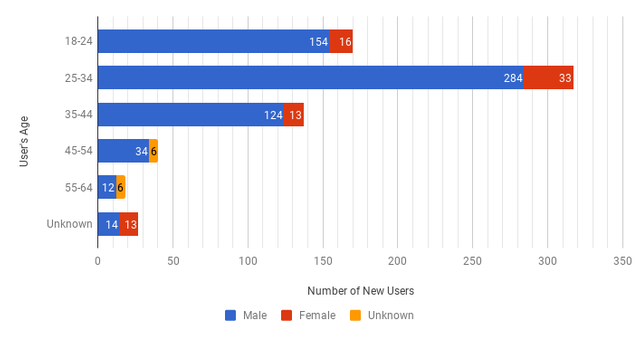
It’s a little sad that only 10% are women but we must remember that Google Analytics registered age and gender of only about 1/3 of all new users, so that statistics can be really wrong.
We have definitely more information about the origin of new users:
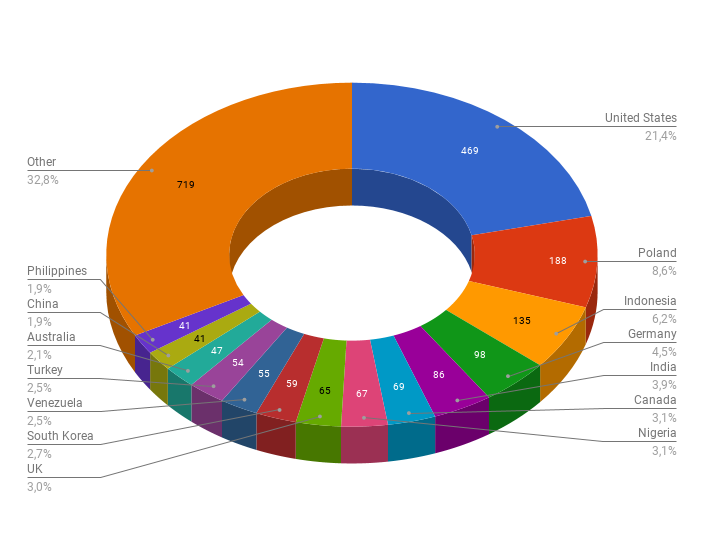
There’s nothing strange in 1st place or 2nd (@noisy is Polish) but further ones are interesting like Indonesia, India or Nigeria.
We can also look at users’ preferred browsers:
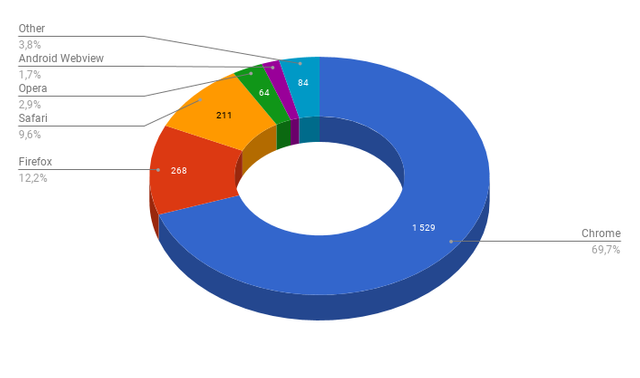
Where Chrome has a devastating victory over all other browsers.
There are also statistics about systems and types of devices:
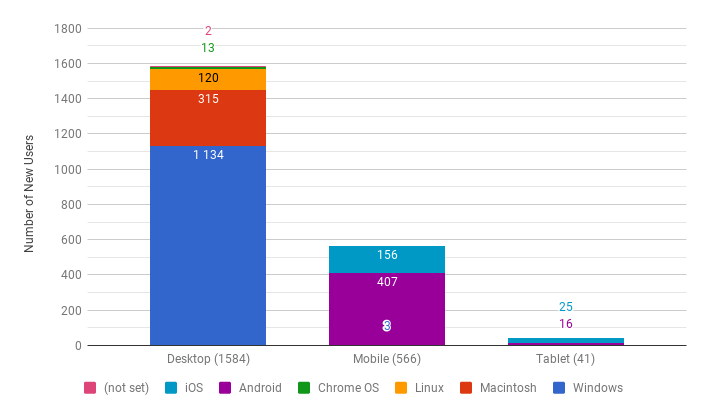
And we can clearly see that desktop Windows wins over Macintosh with Linux and mobile Android wins over iOS.
For some people, next chart can be a little bit boring, but actually, this can give a clue to all Steem Developers, on which resolutions they should focus during development of own project.
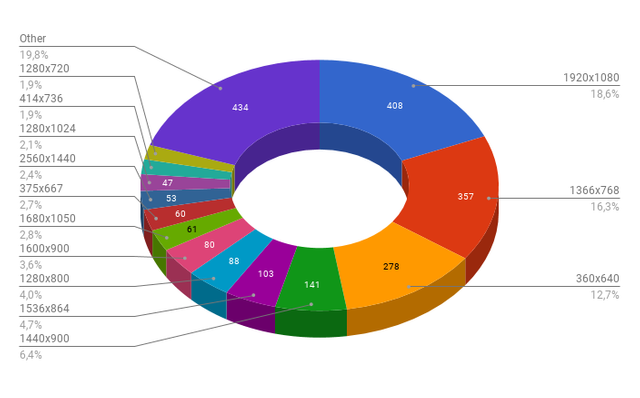
And.. as you can see, your next project should have responsive UI, and should support a wide range of resolutions ;)
Sources of Visitors
Now when we know what kind of users come to SteemProjects we can look into places where they come from. Introducing SteemProjects.com was published in Steem blockchain so people could saw it in many front ends.
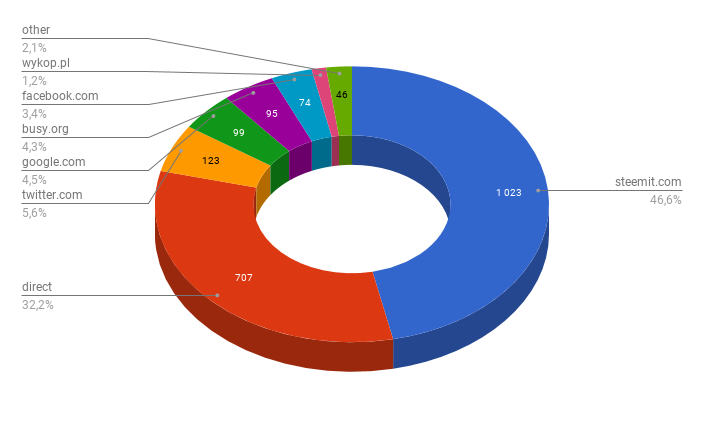
Busy.org, second most known interface of Steem, to put it mildly, was not very popular that day in comparison to Steemit. More popular referrers were: Google and Twitter.
Single Ned’s tweet brought more new users (100) than whole Busy (95):

Conclusion: We should try to use alternatives of Steemit more often. IMO, a project like Busy deserve to have much better stats.
Most visits from Steemit were from introduction post but other users also wrote about SteemProjects. Let’s look at top 5 of them:
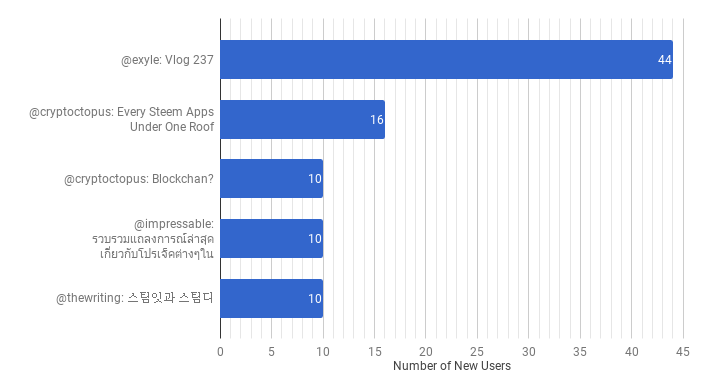
And here are the links:
- @exyle: Vlog 237: Steemprojects.com + different ways of earning STEEM today and in the future.,
- @cryptoctopus: Every Steem Apps Under One Roof - SteemProjects.com,
- @cryptoctopus: Blockchan?,
- @impressable: Steem Projects รวบรวมแถลงการณ์ล่าสุด เกี่ยวกับโปรเจ็คต่างๆใน Steem,
- @thewriting: 스팀잇과 스팀디(steemd)를 오가는 꿀팁.
One more time, thank you for mentioning SteemProjects in your posts!
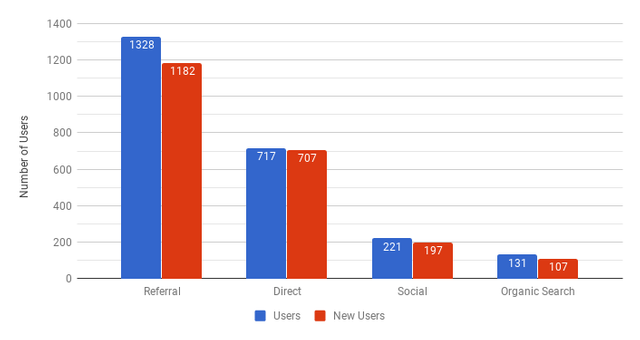
Finally, let’s have a look at grouped traffic sources:
Content
We know who, we know how many and we know from where. There are two things left: how long and what.
For example, we can take average session time and use it with countries. Let’s sort it from the longest time with places with at least 5 new users.
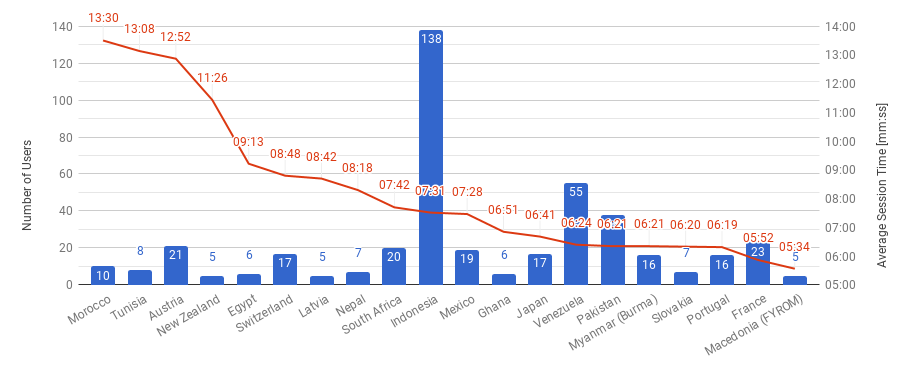
The United States with most new users is not even in top 20, but there is a place for Indonesia with higher numbers of people than other countries. This graph also shows that first 9 places belong to countries with 21 or fewer visitors.
What is so interesting on SteemProjects that people wanted to see? What they were looking for? We will start with categories:
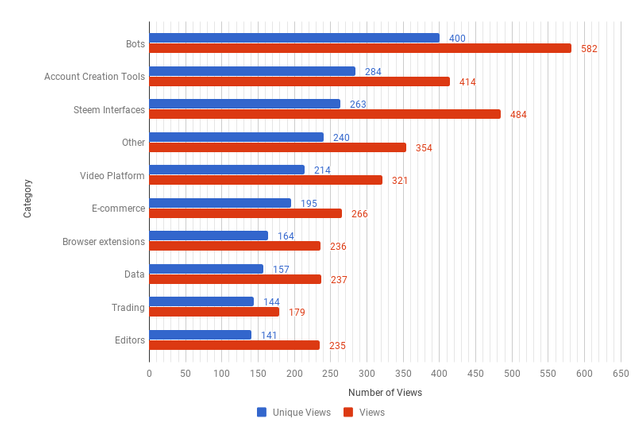
Look at those numbers! Bots had the biggest interest and we all know why.
On SteemProjects you can also find compares, where you can look at different options on few similar projects at the same time.
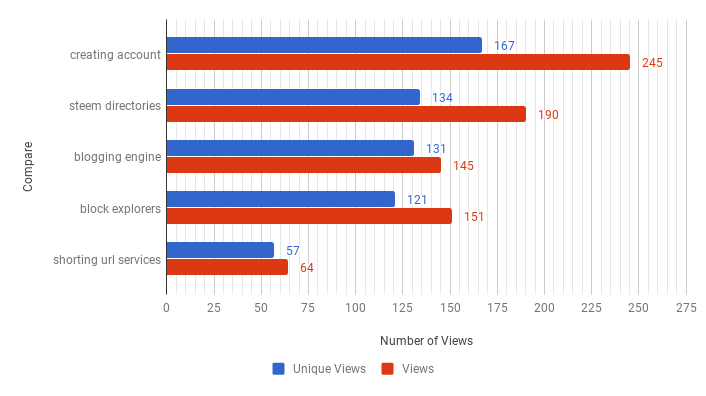
And although Account Creation Tools was on 2nd place in categories, creation account is 1st on compares.
What are the most popular projects in Steem ecosystem?
Well... you will be able to learn more about that from our future blog posts :)

Amazing info! Thank you for sharing with the community. I will check out steem projects. Thanks for the post! Resteem
@noisy You have forgotten to add ads to your project and earn money ...
Wow incredible analysis!
The amount of bots is just sad...
As well as the fact that busy.org is not widely used.
Anyway, congrats guys!
I have a plan in place to eliminate majority of voting bots by introducing new market force :)
Stay tuned :)
I am also looking forward to it!
Oh, that sounds thrilling!
Good news. Strongly support it.
widzę tu ogrom włożonej pracy!!
podziwiam i dziękuję!!
This is impressive and massive and shows that steemprojects is making waves - oh! The stats shows that and it's a plus.
Commenting live from Nigeria and I'm a ardent fan and user
I made it to top 5 ?!!
Thanks to you @noisy
Disclaimer: I am just a bot trying to be helpful.
It's very useful to see these stats. Have you any plans to allow sorting by most favourited? I guess this might be gamed fairly easily, but maybe you could do it by stake weight to reduce that?
You nailed it! This is exactly the reason, why that was not implemented in the first place, because without synchronisation with Steem blockchain and checking SP, this metric would be useless.
I decided to move this from a scope of MVP, but this for sure will be added very soon.
I think, this is also very interesting :)
I wanted to publish separate post after reaching 5000 followers, but that happen so quickly, so I didn't have enough time :D