HOW TO - Make Money Swing Trading Momentum Stocks
.png)
What is Swing Trading?
Swing trading is a form of trading where a position is usually held for a period of time between 2 days - 3 weeks (sometimes longer) whereas day traders never hold a position for more than a day. That's all there is to it. Swing traders try to catch momentum price movements that they think will last more than one day. Sometimes swing traders will use fundamental analysis to help support their bullish or bearish thesis.
Biggest Risk of Swing Trading - Price Gaps
One advantage day traders have over swing traders is that they get rid of overnight and weekend risk. If you're a swing trader, there is always the risk that the stock you own can gap down/up against you overnight. There are a few ways you can mitigate this risk however.
How to Limit This Risk
If you are planning on going long, pick profitable companies with good fundamentals to avoid the risk of them doing offerings (where they raise money and dilute shares) overnight. Profitable companies with lots of cash will most likely not have to raise money to continue their operations.
Find companies with reputable, honest management teams. This may be a tricky one to figure out but it definitely doesn't hurt to look into who is running the company. For example, you can research past companies the CEO has been with and see how he/she performed at those companies. If there is a history of fraudulent activity then you may want to stay away from a company like that. This will help you avoid company scandals that take the market by surprise and cause huge gap downs in price.
Pick mid to large cap companies. Unless you know everything about the company and you know that it is a fundamentally sound company, try to avoid penny stocks or any stocks under $1 billion market cap. Penny stocks tend to have larger gaps than bigger companies.
Stay on top of upcoming news events. This is the most important one. Always be aware if the company is about to report earnings or have news of any sort. The chart can look amazing for a long/short but news will overpower a chart and you can get caught in a big move against you.
Ideally find companies with relatively low volatility that don't gap too often or too hard. This is an easy one do. Simply check the chart and determine if it is too volatile or not. We will get into more detail about this below.
Diversify your swing trades! Never have all of your money into one company. If that one company was to gap down against you unexpectedly, you would lose much more money than you can handle. Try to have at least 3 companies you are swinging, assuming all 3 are quality trades. If there's only one good company at a given time, make sure your position size isn't too big.
What is the Strategy?
Our swing trading strategy isn't too complicated, however we find it to be very effective. It is entirely based on momentum.
Here are the steps to using our strategy.
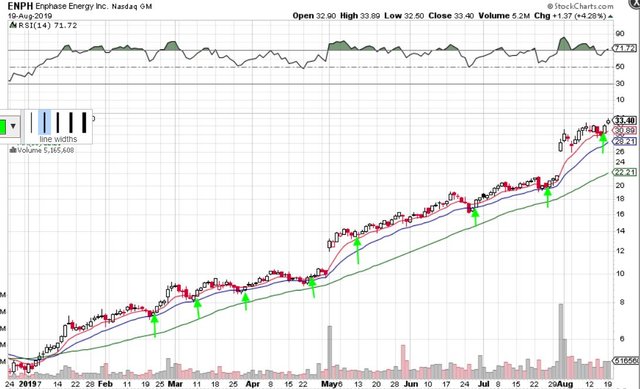
- Find a stock (ideally an established mid-large cap company as we mentioned above) that is showing amazing relative strength compared to the overall stock market. By this, we mean to find a stock that gradually increases as the stock market is either increasing or staying flat. At the same time, the stock maintains its price or hardly drops when the stock market is selling off. This is the most important part of the strategy.
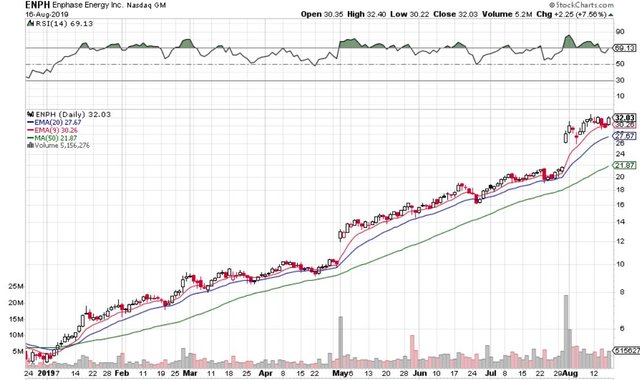
Here's a stock that is showing amazing relative strength to the stock market. We will show a picture of the market below this.
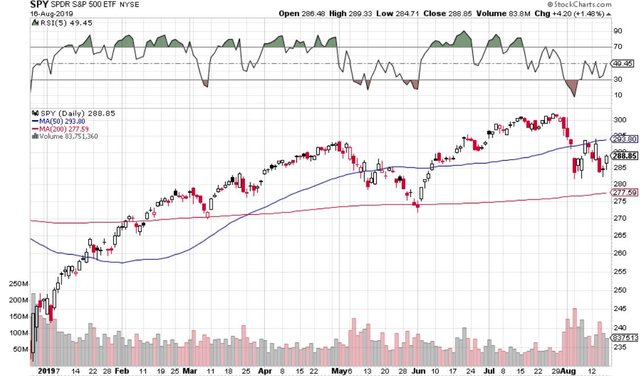
As you can see, the S&P 500 has had many volatile swings in price. The stock above was mostly unaffected by these swings and continued showing strength.
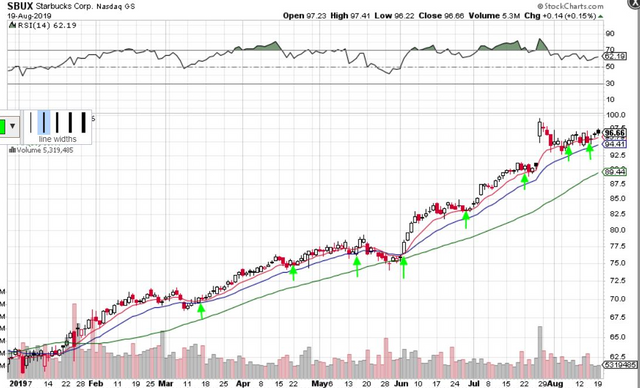
- Use the correct moving averages. Once the correct stock is identified, use the 9 EMA (exponential moving average), the 20 EMA and the 50 MA. These moving averages will help you identify the overall trend as well as picking entry points (we will explain how). What you would want to see is all the moving averages being roughly parallel to each other, all going in the same direction. Below is an example of what this would look like using another stock we like, Starbucks. Note how from November to December of 2018 when the market was selling off hard, Starbucks maintained its price pretty well and recovered very quickly. This is exactly what we look for.
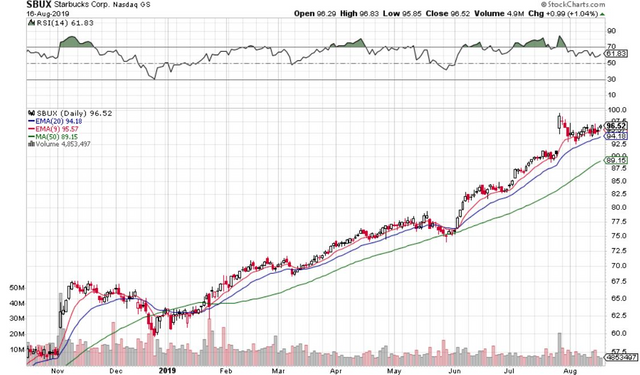
SBUX daily chart. Lots of upwards momentum has caused this stock to weather market downturns. Note how the moving averages are parallel to each other almost all the time.
How to Use the Moving Averages
These 3 moving averages act as support zones in strong up trends. After a run up in the stock, you would want to see the price pull back to its 9 EMA or to let the moving average catch up the price. If the 9 EMA fails to hold as support, the 20 EMA is next in line. If that fails, the 50 MA is your last line of support. The SBUX chart above is an example of a current buying opportunity based off the moving averages. The price gapped up a few weeks ago due to strong earnings (this is a positive sign for future upside), and after the gap, it reverted back to its support zone somewhere between the 9 and 20 EMA. Now it has clearly bottomed out and is looking for another move higher. A stop loss could be put somewhere under the 20 EMA.
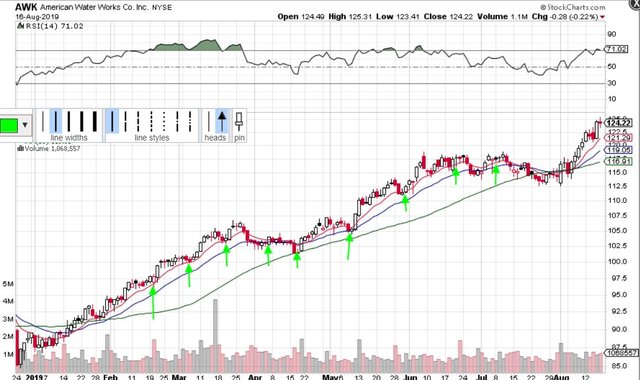
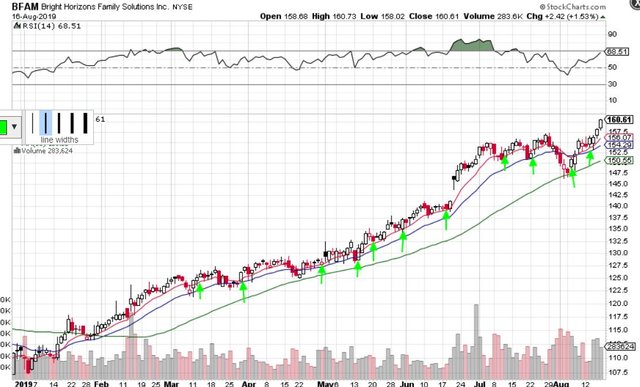
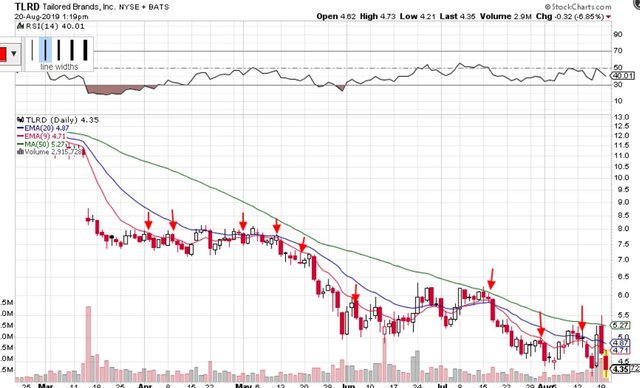
Potential Entry Points on 5 Different Stocks Marked by Arrows Below
Not all entries here are perfect. We didn't use hindsight to draw out these arrows. Some are losing trades, but no strategy is flawless. Most of the trades are winners and are bigger % gains than % losses. That's the key. Have a minimum of 2 to 1 risk reward when entering a trade. Risk $1 to make $2, at a minimum.
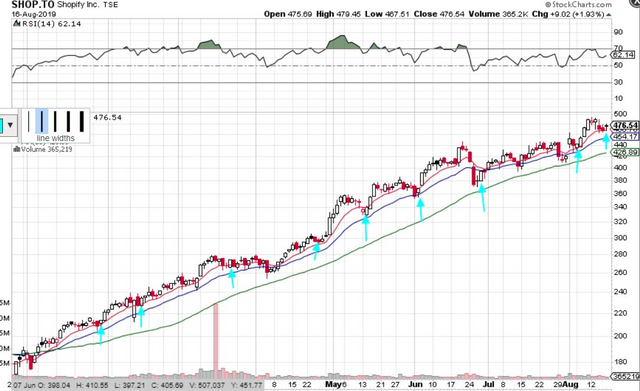
Here's a shopify chart. Another chart that meets the criteria. The blue arrows are potential entry points on pullbacks/consolidations near the moving averages. Notice how the momentum is strong compared to the overall market, moving averages are parallel, therefore the price keeps rising. One can even take a position very early and hold it for months until the moving averages cross over and are not on trend anymore.
Note how the volatility is very low in this stock. This is what we meant by rule #5 above.
A Few Extra Pointers
The charts above are all possible entry points. You'll see some gaps in those charts. Those are due to news events like earnings reports. We put the arrows on the chart before some earnings just to show hypothetical entries based off the chart. However, we would never buy before an earnings report! Remember to always be up to date with upcoming company events before taking a swing trade! It is crucial.
Also, every company is going to have a chart that behaves a bit differently. Some charts respect the 9 EMA more than the 20 EMA, and vise versa. Some pull back to the 50 MA often. You need to take a look at how the chart usually moves so you can base your trades off of that.
Ideally, you want to see at least 2 days of price action consolidating at a moving average to confirm that it is a real support. Strong 1 day bounces off of a moving average also would count as a confirmation. We tend to also look for patterns such as bull flags/pennants, and wedges.
Shorting Using This Strategy
Same rules apply to shorts as they do to the long plays. Just keep in mind that shorting can be very risky to do overnight since there is technically no limit on how much money you can lose.
Follow us on twitter or visit our website https://www.stockbrosresearch.com/ for equity research reports and technical analysis!