BTC/USDT (Binance) short blog update:
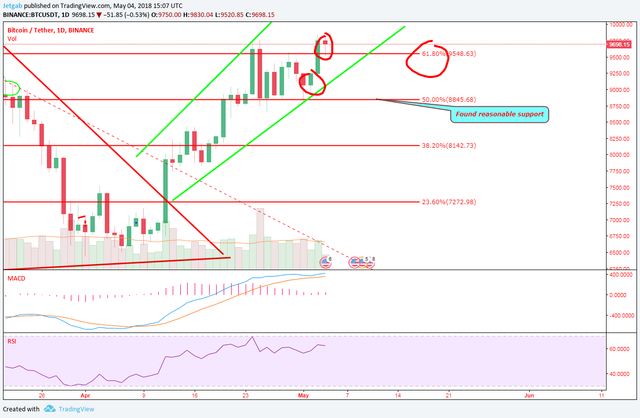
again BTC pumped a bit but the alts reacted again and created a mini dip, but if you observed the BTC day chart you can see the candles are just creating a higher low and higher high creating a very bullish trend I can say.
now it surpassed the Golden Ratio area of Fibonacci which is a bullish sign also, if this holds and consolidates above the $9500 area which is the found reasonable support, we can experience a bull run or maybe a breakout up to $10,000 area up to $10,200 area, but if we look at the indicators we may see a drop because of the seen bearish divergence in the part of the RSI but the MACD is in a bullish convergence, which is another divergence on the part of the two indicators.
Legal disclaimer: I am not a financial adviser nor any content in this article is a financial advice, buy and trade at your own risks. my analysis is based on my view using technical analysis and market behavior.

this post is for the #steemitpowerupph community and the crypto community
Hello! Good article! I'm interested in the them of ICO and crypto-currency, I'll subscribe to your channel. I hope you will also like my content and reviews of the most profitable bounties and ICO, subscribe to me @toni.crypto
There will be a lot of interesting!
okay, thanks!