Probability (P1 Exam Practice) - Venn Diagrams
Actuary Exam P1 Practice
Knowing this simple mathematics, I can make up original problems just given a curriculum. There are many Actuarial Math books out there and a lot of online resources. All one has to do is study, pass one test, and they can go to work. So, here is my gift to steemit. A guide to the P1 Exam!
Venn Diagrams
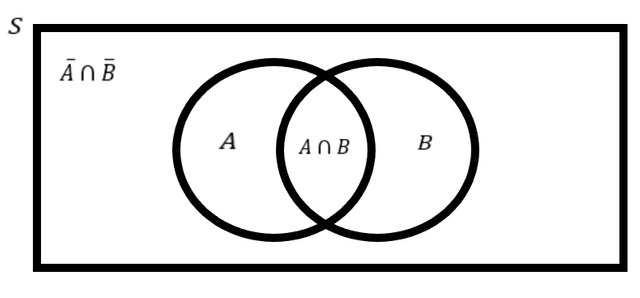
You need to be able to read the Union and Intersection fluently to be able to get through this, so get used to the symbols as well as you can. The middle (what A and B have in common). The outside is what not A and not B have in common! We can view a larger one I made for you.
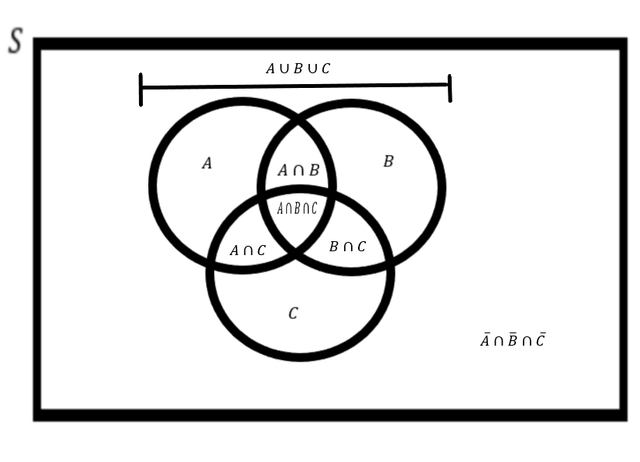
Notice on top of this one we include A or B or C, I like to think of it as the probability of all events occurring since the outside is no events happening.
Example
There are two insurance plans a company has. One for cars, C, and one for motorcycles, M. All customers have at least one plan. Given that 58% of people have car insurance and 12% of people have both car and motorcycle insurance, how many customers have motorcycle insurance.
Lets look at a Venn Diagram:

We can see that since 58% have C, then 100 - 58 = 42% includes people with only M, not both. Add the 12% and we find our answer. 54% have motorcycle insurance. A final view:

We can also deduce that 46% of customers have only C. Notice that C + M - C&M = 100!
Harder Example
Consider a sample space with 3 events A, B, and C with the given probabilities. Find the chance that only C happens.
Pr(A and B) = .30, Pr(A and C) = .20, and Pr(B and C) = .22.
The probability that all events occur is .07.
The chance of none occurring is zero, Pr(A) = .58, and Pr(B) = .52.
We have the following diagram

We need to solve for C, so we find A only and B only first, by adding the middles and subtracting the center. We get this:

Work your way inside to out! Then we have our final diagram with no unknowns:

Thus, the answer is 20%.

