You are viewing a single comment's thread from:
RE: Steem Dollar: technical analysis of 4 February 2018
In my opinion you can't use technical analysis for SBD. You can only use fundamental analysis. SBD has a high inflation as long as the price is above $1. Currently the inflation rate is 9.6% per week or 500% per year. This regulation mechanism results in a SBD price of $1 in the mid to long term.
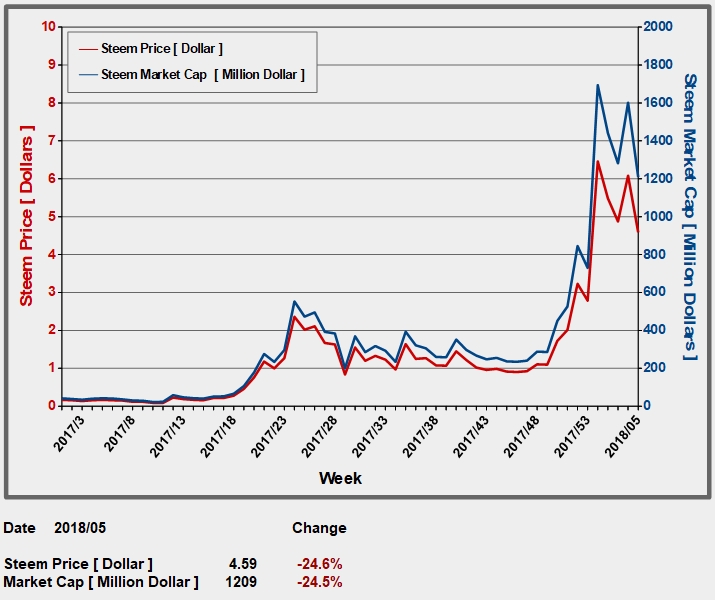
This chart you'll also find in my weekly steemit statistics:
https://steemit.com/steem/@sevenseals/steem-statistic-charts-week-05-new-activity-chart-and-country-statistic-added
Hi Sevenseals,
I respect your opinion but I do not agree with it. In the following chart I entered the Fibonacci levels and highlighted with green rectangles the various areas where the price of SBD / USD has respected the Fibonacci levels.
Apparently these levels are respected.
I fully agree that fundamental analysis is important, indeed, I think it is more important than technical analysis, and this we can see with the latest crash of the Steem Dollar, but I think that to identify good entry into the market, to identify trading signals, technical analysis is to be kept in mind.
This is my opinion.
Sure, you can intermediately trade these signals.