A Real-time Visualization of Steemit Activity
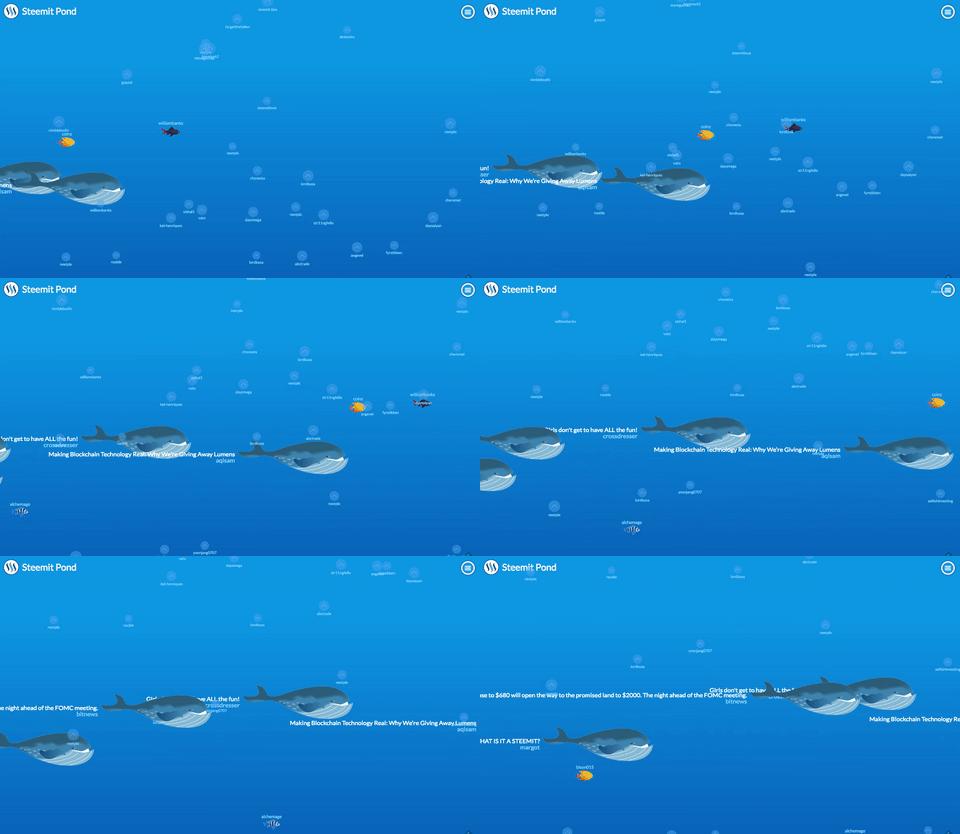
Steemit Pond gives you a real-time visualization of Steemit activity with a unique presentation. Whales and minnows are a common topic of discussion here on Steemit, so I thought I would apply this aquatic theme to the visualization. I am biased, but the results are pretty mesmerizing. Steemit Pond is already my favorite way to find and browse new posts as they are being submitted. Another unexpected aspect of the visualization is that it really allows you to see when there are surges and/or lulls in Steemit activity.
Please take a look at the demo. http://steemitpond.com/
I would also love to get some feedback, both positive and negative. If you would like to contribute feel free to get started.

A Bit More About Steemit Pond
Different transaction types are represented by different objects in the pond. When a transaction is added to the blockchain its corresponding object comes into view and slowly drifts across the screen.

Hope you enjoy!
by the way credits goes to @mynameisbrian
DOWNVOTED - NOT ORIGINAL CONTENT CREATOR
Please make it more clear you are not the original content creator. That's me.
This is especially important since I JUST posted this hours ago.
Please include link to MY original post.
https://steemit.com/steemit/@mynameisbrian/steemit-pond-a-real-time-visualization-of-steemit-activity-with-a-twist
I hate to harp on this, but let's all be cool to one another and quit trying to profit immediately off others work.
Thank you
See below /
@mattyfu Please downvote
sanosakis is not the original content creator. Copied and pasted most of my post verbatim
https://steemit.com/steemit/@mynameisbrian/steemit-pond-a-real-time-visualization-of-steemit-activity-with-a-twist
Awesome , thats really beautiful visualization of the steemit activity
I would suggest adding a header with some figures in text format to help people make a better idea of how much activity there is
Also , i would like to which libraries and framwork use to handle the data and build the viz
@on247 Please downvote
sanosakis is not the original content creator. Copied and pasted most of my post verbatim
https://steemit.com/steemit/@mynameisbrian/steemit-pond-a-real-time-visualization-of-steemit-activity-with-a-twist
Keep up the good work!