I found this Amazing tool (Create Professional-looking Gantt Charts in Excel.)
Gantt Chart Excel is completely automated and it is super easy to use.
If you use Microsoft Excel, you can create a Gantt Chart with almost no learning curve by downloading our Gantt Chart Excel Template.
Microsoft Excel is instantly familiar, so everyone on your team “gets it” and hits the ground running.
FEATURES
Using this Gantt chart template is very straightforward. We have customized the Excel ribbon to include a Gantt Tab with buttons to add Gantt charts, Tasks, Milestones etc.

Task and Milestone Dependencies
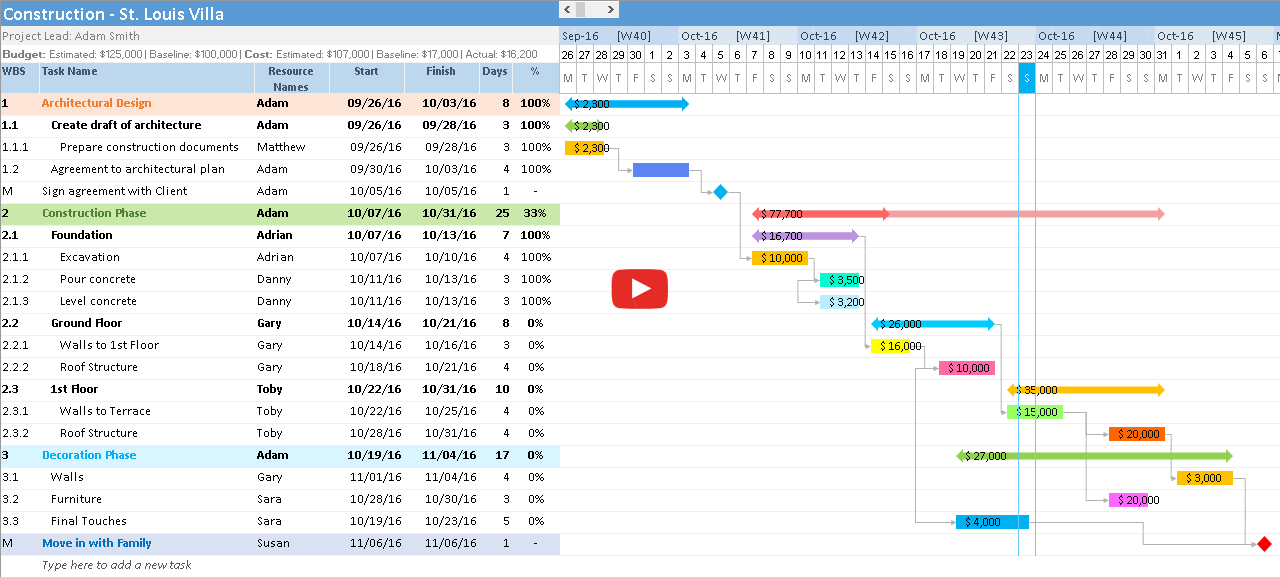
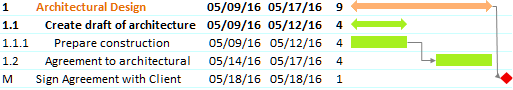
You can create cascading dependencies in the Gantt Chart based on time, so that you see how time changes will affect other parts of the process & the final deliverable.
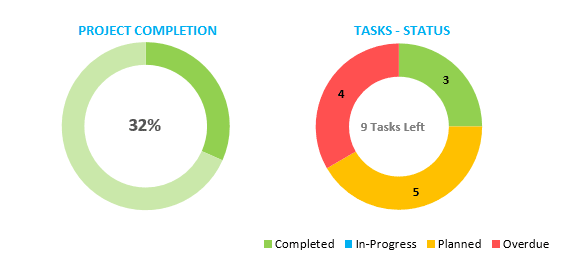
Project Management Dashboards
A dashboard is the best way to easily communicate key project details.
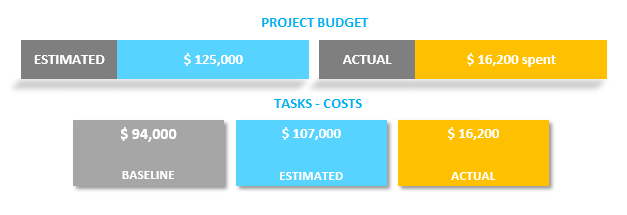
Costs Module – Account for Project Budgets & Task Costs
Gantt Chart Excel doubles up as a budget and expenses template. Keep track of costs and expenditures for projects and tasks
Gantt Chart Excel – Complete Feature List
-Ability to create as many Gantt charts as you want
-Add as many tasks and milestones to a gantt chart
-Add or edit tasks using intuitive forms-
-Duplicate tasks easily
-Set parent and child task relationships
-Create task and milestone dependencies
-Fine-tune dependent task dates using lag
-Select dates using a date picker
-Track estimated, baseline and actual dates
-Auto-calculate duration based on start and finish dates
-Auto-calculate end date based on start date and duration
-Account for holidays
-Set up work week calendar days
-Parent tasks auto-calculate dates, percent complete and costs
-Set project estimated and baseline budget
-Generate project dashboard with the click of a button
-Track estimated, baseline and actual costs
-Set Currency per project
-Track task percent complete
-Highlight overdue tasks in the timeline
-Auto-calculate percent complete or enter it manually
-Set simple or weighted percentage for parent tasks
-Add resources to tasks
-Set resource per day cost
-Add task notes
-Insert up to 10 custom columns
-Show or hide system and custom columns
-Gantt chart timeline automatically updates based on any change
-Daily, weekly, monthly, quarterly, half-yearly and yearly views
-Show estimated, baseline and actual timeline bars
-Task percentage complete bar overlays the estimated bar
-Scroll timeline to start, current or end of project
-Customize timeline gantt bars and milestone colors
-Show or hide dependency connectors
-Today indicator available in the Gantt chart
-Show text on Gantt Bars
read more here : https://ganttxl.com/gantt-chart-excel-download/