OKCoin BTC/USD 15-Minute Candle Chart
From the analysis pages of xbt.social, earlier today:Bitcoin price has done the expected unexpected and stepped over the edge.Those lucky so-and-so’s at xbt.social had a Sell trade open at 04h15 UTC when a valid sell signal (red arrow) was emitted across the timeframes we track (signal restricted to subscribers).Fib extension targets for the declining price wave are near $600 and $550. The Fib extension tool is drawn across the length of the declining wave that starts at the top-left of the chart.A wave count for the initial declining wave is annotated: i-ii-iii-iv-v. Now that we have another declining wave unfolding, it is possible to apply Elliott Wave principle to the chart: the initial declining wave is assumed to be wave 1 of decline. A triangle (magenta trendlines) formed wave 2 – a classic bitcoin chart pattern that has defied wave counts since 2012 – its two potential termination points are labeled “B/2”.Presently we’re in wave 3 of decline – its speed and distance fits with 3rd wave behavior and we can further anticipate that wave 3 will decline to one of the Fib extension targets mentioned above.Note that today’s wave 3 to the downside does not yet exhibit subwave articulations as we see in wave 1. This implies that it is still in its own internal subwave i with subwave ii now forming and we expect subwaves iii and v (each to the downside) to haul great distance.An alternate wave count (not annotated) might see the current small upside correction as subwave iv with only one more downside subwave v to follow.
To anticipate the market is to gamble. To be patient and react only when the market gives the signal is to speculate. – Jesse Livermore
Summary
That additional decline is due in the bitcoin price chart is not a maybe. The present (15h00 UTC) price pattern and chart indicators are unequivically bearish. Potential targets await at $600 and $560. Hopefully, we get a bounce from either of these levels when that first unfortunate miner receives his measly half-portion in the coming days.
Bitfinex Depth Chart and Buy/Sell Volume
Click here for the CCN.LA interactive bitcoin-price chart.What do readers think? Please comment below.This analysis is provided by xbt.social with a 3-hour delay. Read the full analysis here. Not a member? Join now and receive a $29 discount using the code CCN29.Readers can follow Bitcoin price analysis updates every day on CCN.LA. A Global Economic Outlook report is published every Monday.DisclaimerThe writer trades Bitcoin. Trade and Investment is risky. CCN.LA accepts no liability for losses incurred as a result of anything written in this Bitcoin price analysis report.Bitcoin price charts from TradingView. 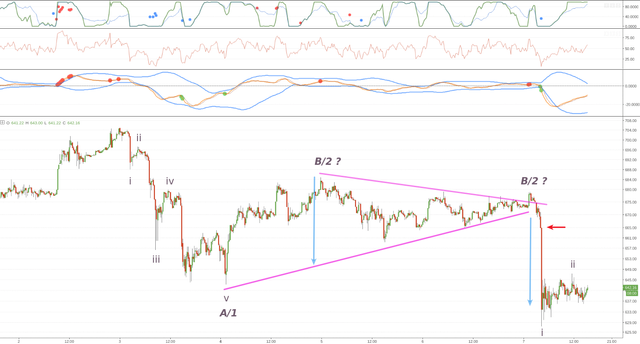
Upvoted you