Hang in there Bitcoiners...Just a Gartner Hype Cycle!
Bitcoin fell back down to ~$2,500 but I agree with this very smart fellow, Michael B. Casey, that what we have is an S-curve of adoption. I'm in it to win it!
Reposting his article here. It's long, but a lot of good analysis here:
Michael B. Casey
(no relation to Michael J. Casey) Bitcoin enthusiast. Data & Analytics Geek. Twitter: @theblackmarble
Dec 27, 2016
Speculative Bitcoin Adoption/Price Theory
Provisos
This is only a speculative theory and may be incorrect in part or in whole. Cryptocurrencies are inherently volatile in nature at this stage and no future performance is certain. DO NOT INVEST ANYTHING MORE INTO CRYPTOCURRENCIES THAN YOU ARE PREPARED TO LOSE IN TOTALITY.
This paper refers specifically to “Bitcoin” simply because it is the most historical, liquid and widely used cryptocurrency currently in existence. The ideas stated here do not apply exclusively to Bitcoin, but rather to cryptocurrency as a whole. Another cryptocurrency may one day supplant Bitcoin, in which case I would expect it to act in the same manner I am describing of Bitcoin. This may be potentially mitigated by studied diversification, but that is out of the scope of this writing.
This paper assumes that eventual near-universal adoption of Bitcoin or 2nd tier technologies (ex. Lightning Network, Sidechains, etc.) based on Bitcoin is a foregone conclusion. While this notion is certainly debatable, the debate remains out of the scope of this writing.
Theory
Simply put:
The growth of adoption of Bitcoin and therefore bitcoin price is following an S-Curve of Technological Adoption, which is itself characterized by fractally repeating, exponentially increasing Gartner Hype Cycles.
This theory represents an overarching long-term fundamental factor that dwarfs the effects of other fundamentals such as: exchange hackings, government regulatory announcements, changes in economic policy and further technological advancement of the protocol. Although, it is important to note that these other fundamentals may spur transitions between Gartner Hype Cycle stages.
The S-Curve of Technological Adoption
As stated above, this paper assumes eventual near universal adoption of Bitcoin. So how does anything transition from a state of zero adoption to complete adoption?
One of the most familiar concepts in marketing is the bell curve of adoption:

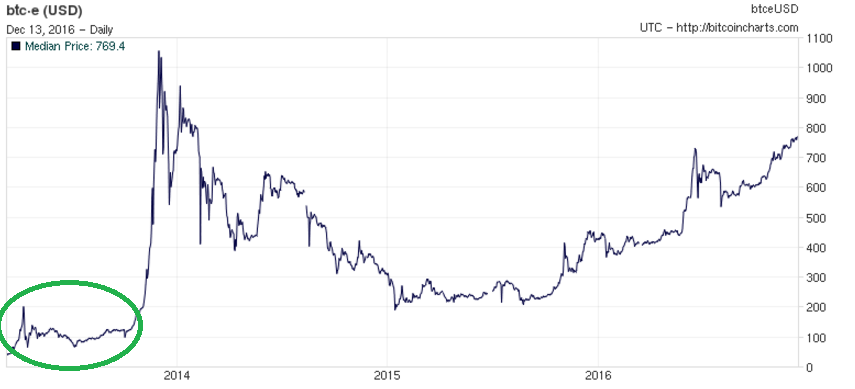
The parabolic curve represents and exponential increase in adoption up until median saturation, then a logarithmic decline in adoption until the whole potential population has adopted. Assuming near-universal adoption, Bitcoin is still likely in the “Innovator” phase, or just barely into the “Early Adopter” phase.
If you make the bell curve cumulative to represent the total adoptive population at a given time, you get the S-curve of Adoption as characterized by the yellow line below:

It’s called the S-curve simply because of its letter “S” shape. Its defining characteristic is the extremely slow exponential ramp up to the point at which growth “goes vertical”, and super-majority adoption is rapidly achieved. Throughout the 20th century every major mass-market technology that was near-universally adopted has exhibited some form of an S-curve, as indicated in the chart below:
In addition, S-curves are becoming more compressed as technology advances, leading to more pronounced vertical growth adoption phases.
So, if Bitcoin is following a standard S-curve, then why is so volatile? Over the long term (decades or more), technological adoption S-curves appear to be very smooth. However, in the short-term, rates of adoption (typically sales to new customers) are highly volatile. If Bitcoin is following a standard S-Curve, the massive exponential increase of the final majority mass adoption will make all present volatility look extraordinarily flat by comparison. This is why long term bitcoin price charts are best viewed on a logarithmic scale.
S-curves can be volatile, but must sustain exponential growth in the long term.
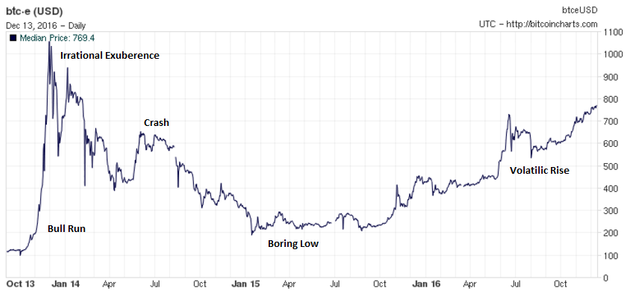
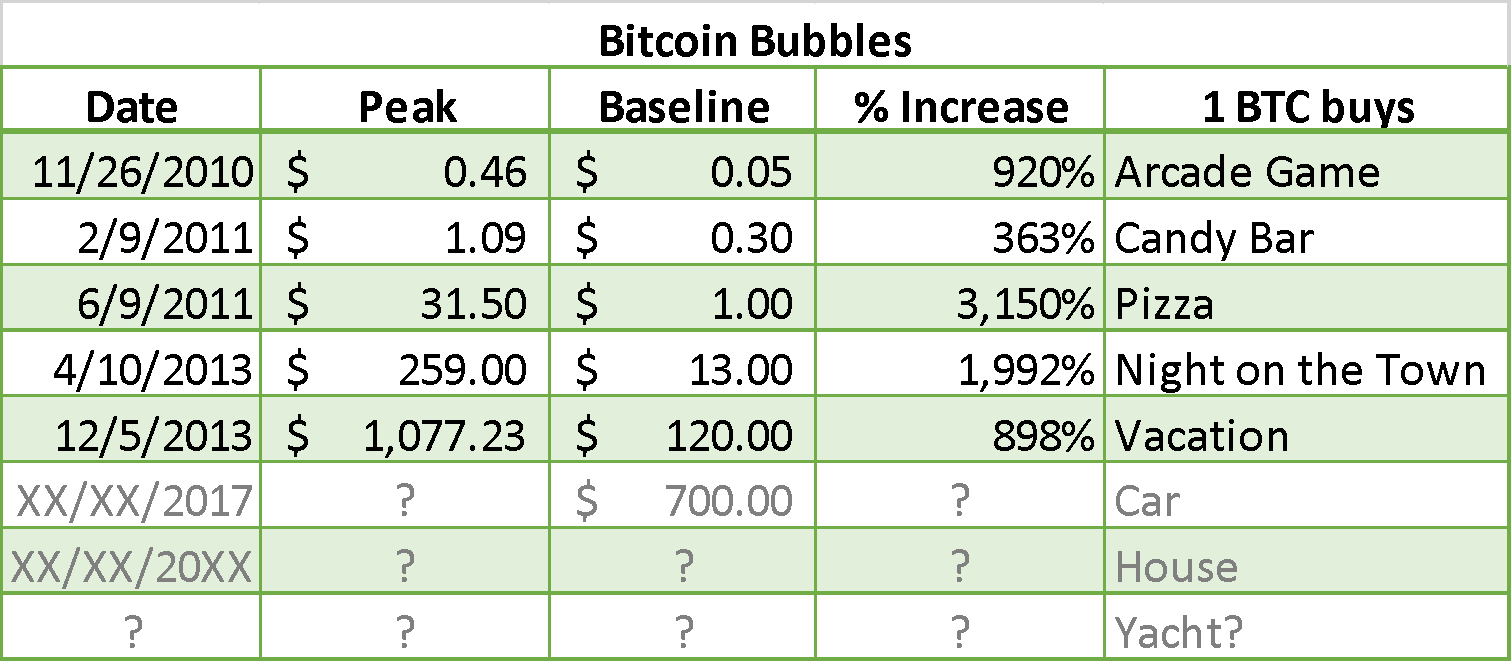
Bitcoin Bubbles & Gartner Hype Cycles
If one researches Bitcoin for any length of time, one invariably encounters the phenomenon of the bitcoin bubble. The price, after rising slowly but fairly steadily for a length time, suddenly explodes by 5–10% a day for a sustained period of time culminating in typically a full order of magnitude (~1,000%) increase over its previous value. This is known in Bitcoin circles as a “Bull Run”.
Since these bubbles are inherently speculative in nature, they reach a point known as “The Height of Irrational Exuberance”, where the sellers begin to outnumber the buys and the bubble pops and the price crashes down to a range above the pre-bubble price; but many multiples lower than the peak. This is typically the time Bitcoin begins to be pronounced dead by many economists and news outlets.
The price stabilizes around this low value for some time, which I refer to as “The Boring Low”. If you are looking to accumulate, this is typically the best time. In this stage no amount of good news seems to affect the price in any manner.
Eventually, the market begins to view the price as stable and speculative investment resumes. This leads to the next stage (which we are currently in), that I call “The Volatilic Rise”. In this stage, the price stair-steps its way back into the vicinity of the old high. Once the price reaches a sustained level of 80–90% the old peak, the bubble cycle typically starts over again with another bull run.
The Nov. 2013 bubble to Present:
When looking at the structure of the bubble phenomenon, it is difficult not to be reminded of another commonly accepted concept in technology: the Gartner Hype Cycle, which illustrates Amara’s Law:
“We tend to overestimate the effect of a technology in the short run and underestimate the effect in the long run.”
Gartner Hype Cycle:
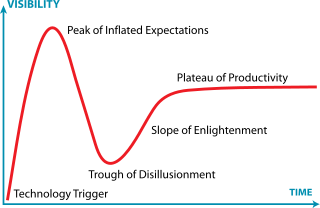
Basically, for anything new there is a mad flurry of excitement over potential applications, followed by the realization that most of them don’t work, followed by a slow learning of what does work, followed by sustained progress.
After much careful examination; it becomes apparent that a roughly analogous pattern of excitement, disappointment, and cautious optimism occurs in both a Gartner Hype Cycle and bitcoin bubble.
Unlike a typical Gartner Hype Cycle, a bitcoin bubble does not reach a steady state of gradual increase. As mentioned before, it must continue to follow the exponentially increasing path of the S-curve. Why then does it follow the hype cycle at all? This is because the nature of bitcoin investment is almost entirely speculative. Speculation is driven, in large measure, by hype.
To illustrate the relationship of hype over bitcoin to bitcoin price, this chart shows the base-10 logarithmic bitcoin price plotted along with Google Searched for “bitcoin” as found on Google Trends:

It has been noted that in the past, extreme spikes in google searches for “bitcoin” and “buy bitcoin” have been leading indicators of bitcoin price increases be several weeks; presumably because of the historical learning curve required to purchase and manage bitcoin.
Because the price of bitcoin rises so phenomenally fast during a bull run, speculators begin to view the price as illegitimate and unsustainable. A great many who bought in before or early on in the bull run, liquidate to lock in profits, leading to the crash. Only after the stable Boring Low and the steady Volatilic Rise, do the speculators consider the possibility of the bull run price being “legitimate”. Once legitimate and established as the new base line, the hype cycle begins anew with another bull run.
Exponential Fractals
Fractals are a fascinating branch of mathematics, in which often relatively simple formulas evaluate to infinite complex patterns that repeat themselves over and over again at different orders of magnitude. Fractal mathematics are often employed in technical analysis of Forex markets and by high frequency trading bots.
Though I have not seen any work toward a definitive fractal formula that describes the way bitcoin’s price behaves, I believe there is ample evidence that a fractal pattern is present. It represents itself in the form of exponential bitcoin bubbles driven by Gartner Hype Cycles. I’d imagine there is enough to study in this area for several Doctorate dissertations.
The next few pages illustrate the striking similarity of the fractal pattern of the bitcoin bubbles, each roughly a full order of magnitude greater than the preceding.
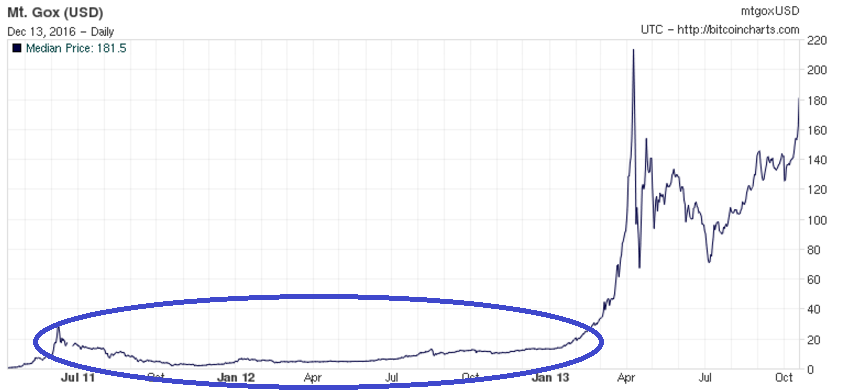
Nov 2013 bubble with preceding Feb 2013 bubble:
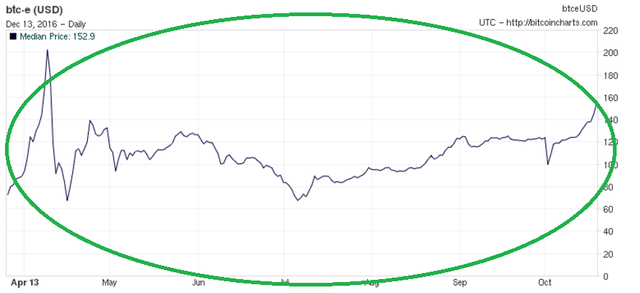
Feb 2013 bubble with preceding Jun 2011 bubble:
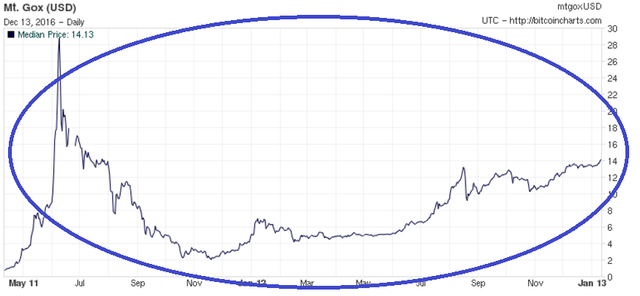
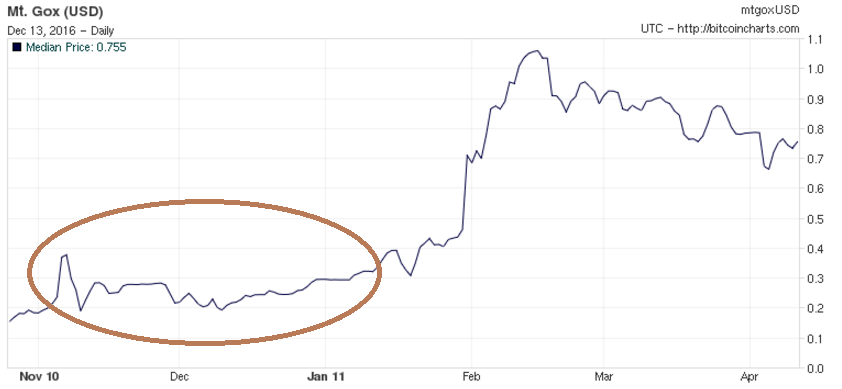
Jun 2011 bubble with preceding Jan 2011 bubble:
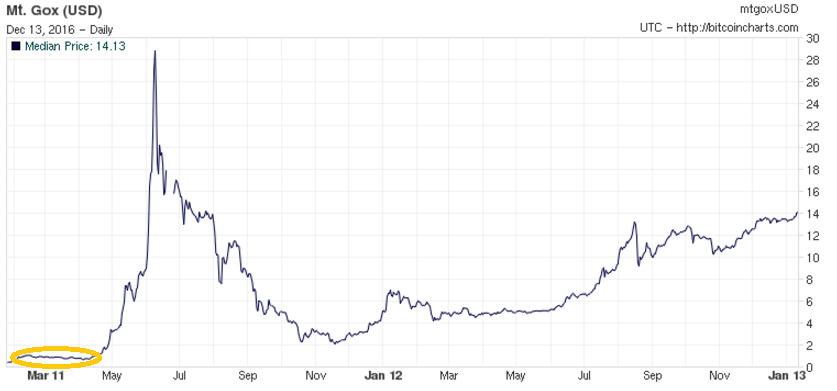

Jan 2011 bubble with preceding Nov 2010 bubble:

I believe that the pattern is a fairly pure representation of the psychology of large groups of independent speculators each attempting to act rationally trading a rapidly appreciating asset. The primary motivators of these movements are greed and fear and are fundamental to human nature. The bull run happens due to a tipping point of hype where greed and fear of missing out (FOMO) take hold and speculative fervor ensues. More speculators see this and jump on the bandwagon, accelerating the run. Eventually, the return for the initial speculators grows so large, their fear of losing the money they have earned outweighs their greed for more and they begin to sell. The price increase has been far too rapid to possibly be legitimate.
From here, the bull run peaks out and the crash begins. People who bought in at the height of the fervor begin to lose money and sell to avoid further losses. These people are typically short term speculators generally uninterested in the technology and looking only to make a quick profit in fiat. They are commonly referred to as “weak hands”, because they fold (sell) at the first sign of trouble; usually losing money on the transaction. The crash is the process of the market shaking out all of the weak hands. The crash ends when nobody with bitcoin is willing to sell it, these are typically long term holders and the total number (and combined worth) of them grows after each bull run.
After the crash, the narratives of Bitcoin dying or being too volatile to serve as a store of value need time to subside. During the boring low, there is not much speculative action and the price remains relatively stable. New speculators see no reason to jump into the market as the asset isn’t appreciating and those holding don’t want to sell at a low. This continues on until speculators begin to view the price as stable.
As time goes by with a stable price, speculators collectively begin to see the value as potentially low. Several new whales research the technology and buy relatively large amount spurring mini-bubbles that spike and then reverberate stabilizing over time with a general uptrend. This stage I refer to as “the Volatilic Rise”. The price basically stair-steps in increments on the order of magnitude of the pre bull run high (ex. right now they are ~$100). The price rises and falls, generally with a long term upward trend until reaching roughly 80% of the peak price of the bull run. The formerly impossible price of the peak now appears real and relatively stable. A new hype cycle begins and greed and FOMO lead toward a new bull run.
That’s the cycle. By my count is has happened in Bitcoin 5 times so far, and as human nature does not fundamentally change I see no reason why it won’t happen 2–3 more times:
The last bull run that happens will be the exponential increase that characterizes the S-curve; wherein the majority of the population of the planet will all adopt bitcoin in a relatively short period of time. This is known as the knee of the S-curve where it goes vertical and is likely still years away. When bitcoin takes over, it will happen quickly.
Conclusion
Bitcoin is probably the purest example of speculative adoption humanity has seen to date. It is following a typical technological adoption curve at a rapid pace. The S-curve is made up hype cycles which repeat in a fractal manner. Each fractal repetition is roughly one order of magnitude greater than the one prior. Since reaching dollar parity, the percentage increase of each bubble over the last has been decreasing, even though the $ increase grows exponentially. There are likely 2–3 remaining hype cycles before Bitcoin becomes near-universally adopted.
At present, all technical indications are that we are several months away from a new hype cycle and bull run. I anticipate we have one more plateau in the volatilic rise phase before then, likely around $900.
It is impossible to tell the exact timing and exact peak of a bull run, however general time frame and rough order of magnitude seem plausibly predictable. I first identified this pattern in mid-2013 when the price was $70, with a former all time high of $258. I was able use this knowledge to forecast the rough timing and order of magnitude of the November 2013 bull run to $1,177. My models however had me convinced the peak of that bull run would be ~$2,500. I have since come to the conclusion that accurately calling the top of such a massive increase is a fool’s errand. As a general practice, you are better off selling progressively toward the top, then waiting for the crash and buying back progressively toward the boring low; with the goal of increasing your long-term bitcoin holdings.
Again, all of this is pure speculation. Please take this information with a grain of salt and do not risk anything you would be uncomfortable losing.