Standards of living 1960-today from multiple Western cities and what has happened...
Economics and monetary history is a passion of mine, as well as learning about monetary history and trends.
In this report, I'm going to measure the monthly disposable income/expenses ratio that the middle-class salary earner is comprised of. I say middle class, because an economy is measured by how well you have the possibility to get ahead and have a decent standard of living (as measured by the middle class).
These are going to be measured from 1960, going every ten years, and then currently to Feb 2018. I start at 1960 because that is when the economies in the major Western countries recovered from the post-war Lean Years.
I am also excluding countries like Ireland, S. Korea and other countries that have known great poverty or war, because the difference is too great to measure, and those countries are starkly different today.
Seeing as nations like the US, UK and Western Europe have known peace and prosperity in this time, they are more reliable measures of economic trends.
In this ratio's definition, the "disposable income" is defined as income of one's salary that one keeps after paying taxes, and expenses are defined as the average cost of food, rent, gas, the costs of occasional and responsible entertainment like cinema, drinking and socializing.
In other words, the ratio is supposed to mean: what the person can afford to save and put away, either for spending, the future or investing, after expenses... So for example, if the ratio is 1.65. that means that he/she can put away $1.65 out of every dollar earned after taxes and living expenses.
The higher the better. It is also a way of measuring the middle-class earners purchasing power and standard of living. The Middle class is important because it is this class that indicates the strength of an economy in general.
One thing that is difficult to measure in this is inflation. Inflation is not taken into account in too many government statistics, and I will ask if inflation has had an impact on the US dollar and the standard of living.
First, a few questions to give us an overview and some context...
⦁ The ideal ratio for an average middle-class earner in a normal economy is... 3
⦁ The disposable income/expenses ratio for the average middle-class family in the USA today is below that... 1.19
⦁ Disposable income/expenses ratio for the average middle-class family in the USA is is steadily increasing, after a long trend down... But just because it has reversed doesn't mean it stays that way.
⦁ In 1960, the disposable income/expenses ratio for the average middle-class family in the USA was... Around 3.4.
⦁ It has declined since the US went off the Gold Standard in 1971 up to now.
⦁ The US Dollar has lost most of purchasing power up to now since the US decided to go off the Gold Standard in 1971... (98%)
⦁ The middle-class familiy is in trouble in their ability to get ahead when their disposable income/expenses ratio is below... 2
⦁ The US economy is unable to sustain the current national debt.
Now, I'm going to do something very unconventional...
It's not a good idea at all to use ratios in this case for other countries, because to measure using dollars is misleading, because those countries don't use dollars, some like the Italian Lira even used multiple numbers! Also another thing is because of the exchange rates at the time... The dollar had a lot of purchasing power compared to them.
Instead, for the cities of other major countries, I'm going to be using TIME as an indicator of wealth and purchasing power.
You see, it's not the digits of money you have that ultimately matter, it's a matter of how much time that money would last you if you had no job tomorrow! Your wealth is measured by the amount of time it would last you... Here in Dublin, I am VERY poor, because without a recurring income, I would last only 4-half months... But in India, I would last a LOT longer than that, so I'm richer in India!
So measuring time in terms of wealth is one way to indicate a standard of living.
So, a table... How long the middle-class family (with the husband working only) would survive if they had to live on their yearly disposable income without a job, and in what year...
So for example...
in (New York), in (2000), the average middle class-family (husband, wife, 2 kids, the husband working only) living there was able to survive on their yearly disposable income without a recurring income for... x months.
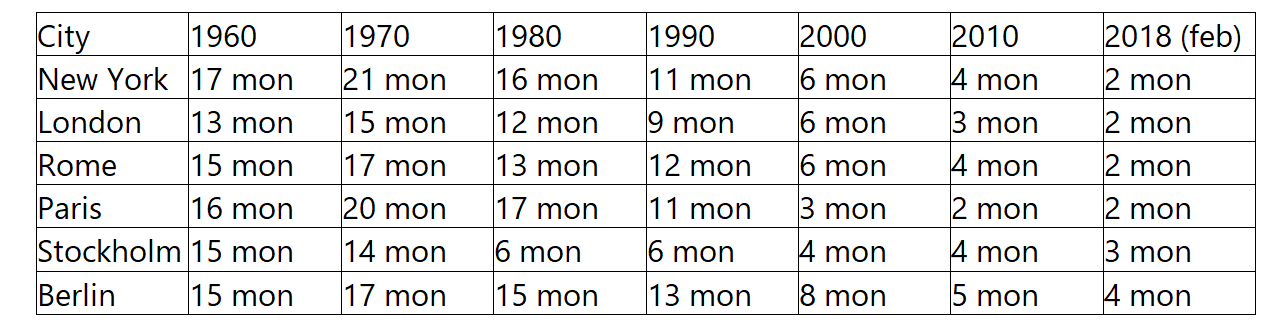
⦁ New York emerged as the winner through the 60s and 70s! Not surprising of course, because the USA had the highest amount of gold at the time, and had emerged as a military and economic superpower.
⦁ Berlin also comes first in February 2018. I have noted even from my own experience that Berlin is quite inexpensive compared to other major European capitals... However, income there was poorly paid compared to other parts, and unemployment is high there.
The huge decline in the time following the decades can be explained by the following trends...
⦁ Inflation... The US dollar has lost around 98% of its value since 1971, as just mentioned. Medicine and third level education have skyrocketed over the decades, with many still paying off student debt loans over 20 years. Of course, inflation is downplayed in US statistics. Inflation is also known as the "silent tax". All of this inflation was to pay for wars, for political promises made by candidates, as well as to pay for other entitlement programmes like the "Great Society", perpetuated by President Johnson.
⦁ Market manipulation of assets... Real Estate, the stock market as well as the bond markets, have all been tampered with and propped up, in order to prevent a market crash, with the result being that the prices are far overvalued compared to the value that they actually produce. As a result, inflation in the US, UK and Eurozone is now ahead of wages and salaries for 16 consecutive years. This results in a lower standard of living for those not involved in the banking and financial sector.
⦁ Credit and debt... This is a recent phenomenon, in the past, most people didn't use credit to purchase items, such as vacations, cars, plasma TVs, or other consumable goods. Today, it is practically trendy to go into debt in order to buy the latest iPhone or handbag. Credit card debt (and borrowing against one's home equity) is a chronic problem that affects many in the middle class, as well as below those classes. Our whole economic system is built on credit and debt, hence the central banks' obsessive desire for economic growth. Without economic growth, the whole economy collapses.
⦁ High taxes... The late 50s, 60s and up to 1971 were the best years to be getting ahead, as income and social security taxes were low enough and inflation very low, and was rapidly outpaced by salary hikes. Not anymore. Taxes are very high today in the Western world. Also, taxes have creeped into many other things as time went on, so one is not only taxed on one's income but on many other things and services too when one spends money (you're also taxed based on what you own). What many people don't know is that inflation also moves one steadily up the tax bracket, which also means more taxes over time.
⦁ Government/public sector growth... What many people don't know is that when the government or public sector grows, that means more money comes out of the private person's pocket. The public sector does not produce anything, it only consumes. Governmental growth has outpaced the growth of the private sector in the US for 25 consecutive years as of February 2018 by an average of 10-11%. What is also interesting to know is that the salaries of government employees are all adjusted for inflation, which only harms and further drains the private sector, which makes those public jobs possible in the first place.
⦁ Entitlement programmes... The Baby Boomer generation is entering retirement by at least 10,000 every day. Promises to be fulfilled in the future (or as known on a financial statement as "Off-balance liabilities") to the older generation have been made, which basically runs up to at least $100 trillion, which the current working generation, which today produces around $12.5 trillion, is going to have to pay and sustain. Also, social security and retirement care costs are actually hedged from inflation, which only increases the cost burden for the working generation that supports them.
⦁ Lower interest rates... They are ridiculously low today, to the point where the money sitting in the bank grows at a pathetic rate, while bank interest rates for borrowing money are nearly double what they were in the late 50's-mid 60's. It also means that savings cannot grow, which families and wealth individuals did back in the days often for the purpose to raise capital. In some countries like Switzerland, interest rates are even negative, which means YOU are charged for giving them your money as a depositor (which they can then use as leverage in loans!). Think about it... Would you be willing to pay someone to lend them your money?
⦁ Litigation... As a result of extremely high litigiousness, risks for institutions like insurances companies and hospitals are hugely increased. This necessitates higher insurance premiums to compensate for the risk of being sued, as well as extremely high medical charges to meet those expenses. Those costs of course are passed onto the laymen who pay for insurance, whether for one's car, health or other things like treatment.
⦁ Regulation... In today's world, regulations and beauracracy (not to mention litigiousness) have sky-rocketed to the point of absurdity. They say there is no free lunch... There is no free red tape either. As businesses and private individuals have to pay for regulation compliance, those prices are naturally passed onto the consumer.
⦁ Labour costs... With government-mandated benefits being enforced, companies both large and small are forced to take creative measures to avoid these stiff penalties, including keeping employee counts below a certain level, as well as employing other people only on a part-time basis, which means employees lose. Germany for example has the largest employment-and-unemployment-benefit costs of all countries in the world, which means that companies there are quite reluctant to hire. Are you surprised to learn that Germany has double digit percentage unemployment rates (15% out of the whole able-bodied workforce as of February 2018). Also, Germany has had double-digit percentage unemployment rates for 14 consecutive years.
⦁ Financialization... This word means to be dependent on the financial sector. Cities like New York, London and Dublin are propped up entirely by the financial sector, which means that mass amount of wealth are concentrated in one area, while rates of homeless and unemployment are also very high in those same areas. Financialization of a city means bubbling property asking prices and rents, which means those expenses spill over to the rest of private services. It also means that it becomes harder for those not involved in the financial sector to have a life there in which they can get ahead.
Another thing to add is that all this is happening in spite of the fact that both parents are working very often nowadays, and not just one parent like in the 50's and 60's! It used to be the case where the man only had to work... Not anymore. Today, both parents have to work a lot of the time, and they still hardly get by. These trends threaten the economic well-being of the average person and family.
Of course, this has consequences for one's health, one's well-being, as well as children being raised. It in turn affects our society, as society is shaped by how the future generation is raised.
Now of course, there were things that were VERY expensive at the time that now cost peanuts in comparison... Airline tickets and electronics for example. But in terms of daily standards of living and the ability to get ahead, things have taken a toll, big time!
People ask "how did you get all this data"?
For the US, it was rather easy, as the web has plenty of information about housing prices, wages and salaries, tax rates, prices of common consumable goods stretching years back, as well as fast food menus! Just look at a McDonalds menu going back in the years, and you'll see proof of inflation on a large scale.
As for Germany, Italy, France, Sweden and Britain, it was less easy. A lot of information was not on the web, and I simply didn't know where to look. But what I did was I contacted both ordinary people whose grandparents lived in those eras via social networks and Yahoo! Answers, as well as people who worked in the government archives in those areas, where records are kept in paper, and I let them know what I was doing, and they were quite enthusiastic about it, seeing as I was just doing research and collecting data. As for the archives, I just pretended I was a government-sponsored economic analyst! hahaha.
It is common that the older generations keep old records, such as income statements, red tape documents, as well as memories of what things cost, and how much they earned, and so on. And you know old folks... They LOVE to share how their times were!
It needs to be said that while this is not definitive of EVERYONE (which is why I said AVERAGE family), I basically added up the average cost of certain foods, grains, gas, cars, health insurance, apartments rents and house mortgages per month, and pitted them again the monthly and yearly salaries, tax rates and the private debt of certain middle-class jobs, such as managers, store owners, doctors, lawyers/solicitors etc, and then I made a rough estimate of how long they would be able to live as a family unit (man, wife and 2 kids, with the man working only) if they had no job tomorrow.
Of course, this was not a definitive way of how the average family lived, I was merely illustrating the POSSIBILITY, which of course depended on the responsibility of the family unit, as well as how disciplined and forward-thinking they were.
Thank you for reading! If you have anything to add to the report, please comment below! I'd be happy to hear from you.
By the way, does anyone know how to underline a sentence in Markdown? I can't freakin' find any tips. Thank you!