Understanding CryptoCurrency Trading. A Beginner's Guide. [A CryptoTrading Guide Series] - Episode 1 Pilot
Hello Dear Steemians,
This is the second series in my long term posting plan in which I'll be exploring Cryptocurrency trends and trading terminologies, experiences, and practices.
Trading in Cryptocurrency requires a few things to be kept in check:
- Investing the money which you think you won't mind if you lost. (The most IMPORTANT and COMMON advice)
- Do not panic when you see fluctuations. Cryptocurrency trading is still in its early age, unless it gets matured enough, you'll see the hills and ocean bottoms every minute.
- Observe the trend. Take a step back and observe how the trend is going. So that you'll get some idea about when not to push the boat out.
- (The second MOST Important one) This is not some get-rich-quick scheme. Do not expect to wake up at night with a billion dollars in your bank account.
There are many others, but as of now, you only need to keep these in mind if you seriously want to start looking into cryptocurrency trading.
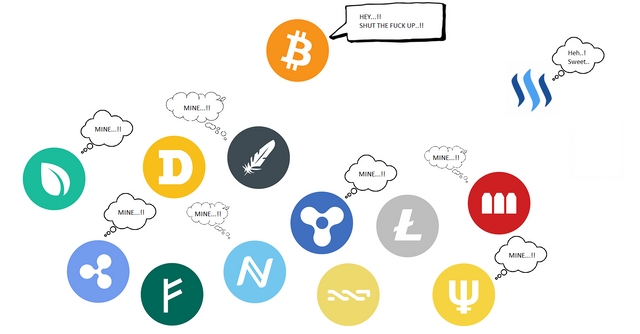
As I move forward with my learning sessions, I will keep on sharing my discoveries here so that many "Sofa King Noobs" like me can understand what exactly is going on in this star trek looking cutting-edge technological world.
If you have a little knowledge about the stock market, you probably already know the types of stock markets, well, not exactly "types" but more of a terminology used to explain current trends in the market.
Like bear market and bull market. These are rather temporal terms used to explain any individual stock market. Any stock market can be bull or bear at any given time.
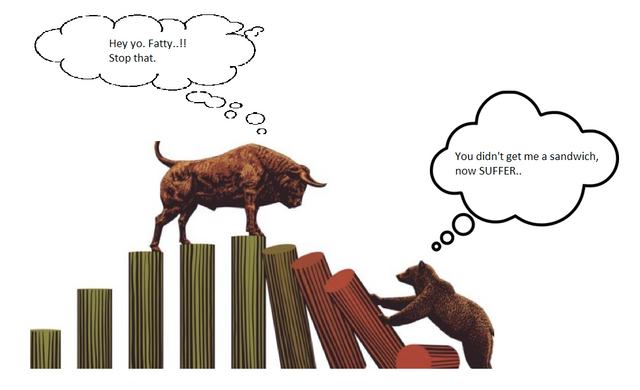
Image Credit + Edited By Me
Bull Market:
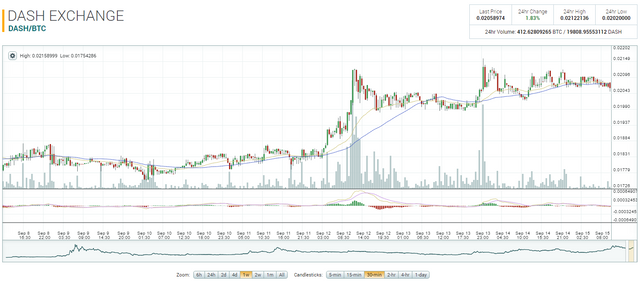
The market is called a bull market when the prices are either on the rise or are expected to rise according to the observations. From what I understood seeing the current cryptocurrency market trends, DASH/BTC market is a bull market as of now. Because it is on the rise since last one week. You can see the chart below which I took from Poloniex. So these rising prices mean the buying is encouraged. People are buying DASH, as a result of that, the demand is increasing. So when the demand increases, the price increases. So there is a positive association between price and demand.
Bear Market:
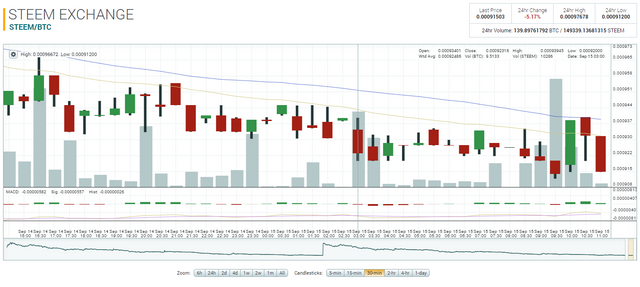
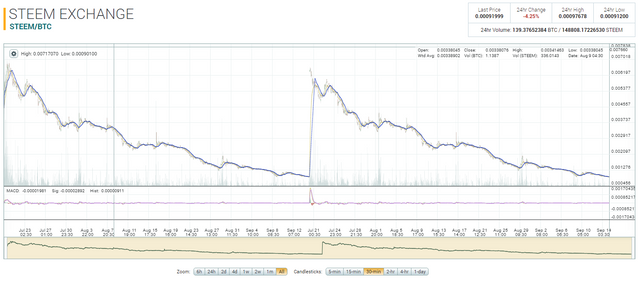
The market is called a bear market, if the prices are falling down like a skydiver without a parachute or are expected to delve into the ocean according to the market trends. Currently, the STEEM/BTC market is a bear market. Below image shows the trend line, "Down Trend line" indicating a bear market. It simply means that demand is decreasing. People selling off their property to save themselves from an anticipated tornado.
As The second point says, do not panic when you see fluctuations in the market. See the STEEM/BTC over a long period of time, you'll notice ginormous fluctuation. I'm not taking bitcoin into consideration here otherwise you'll have a mini heart attack seeing how bitcoin once touched the hill of ~1200$ (or probably more) and then ocean bottom of ~200$. Highly volatile market, well, not as turbulent as my Ex's mood while she's on her periods, but still. So this will give you the exact terms to search on Google and learn more about them.
A Chart Representation of STEEM's all time performance.
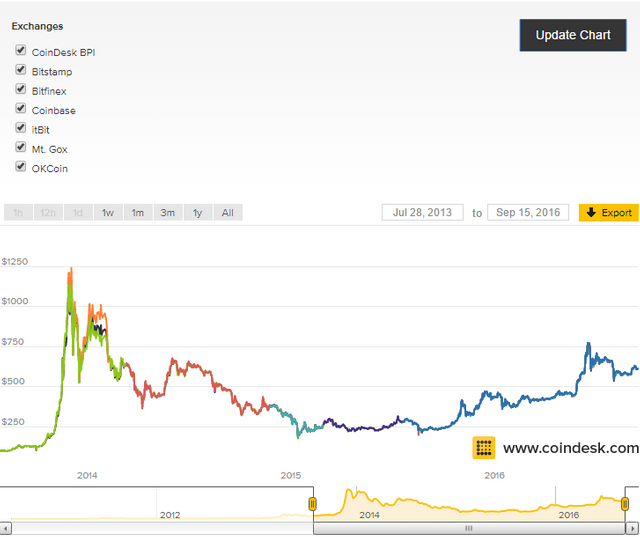
A Chart Representation of Bitcoin's all time performance.
Ok, so now that is settled, we shall look at some charting methods used to show the trend in the market.
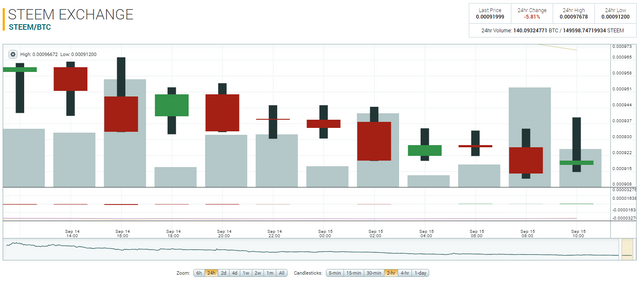
First train in the line is "CandleStick Chart". Below is the candle stick chart.
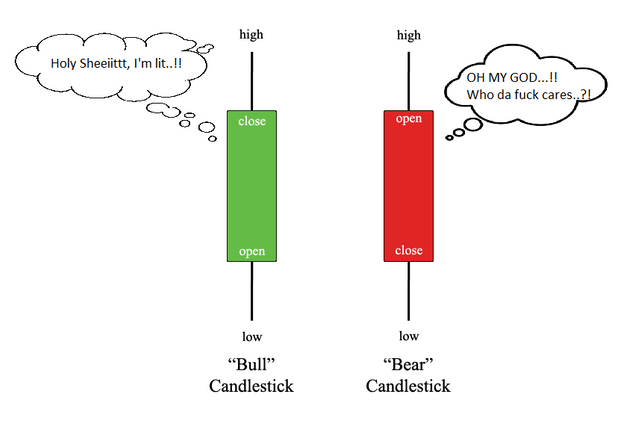
Image Credit + Edited By Me
Aesthetic, isn't it?
So let see how this candle stick chart works exactly. As I've seen on Poloniex and other exchange portals, they offer CandleStick Charts (With the combination of Bar chart and Line Chart) showing the prices within the period ranging between 6 hours to All time. And you can also select the time duration to be depicted by a single candle on the chart (like 5 minutes to 4 hours or more). If you select 48 hours timespan, it will show CandleStick chart of the market trend within the previous 48 hours, that's a zoom thingy. And when you select the time period representation of a candle, say 5 minutes. The candle will show you the trend within that 5 minutes of timespan telling you whether the market acted as a bull or bear market. While reading, I found that CandleStick charting method was invented by Japan somewhere in 1600s to track the prices of Rice. They LOVE rice, and me too.
Now lets take a look into what a single candle shows us about that time period. For the sake of simplification, understand, that almost all the exchanges show green candle if the market acted as the Bull Market during that time period. And a RED candle if the market acted as Bear Market. In the green candle, the lowermost horizontal line shows the price where the market opened and the uppermost horizontal line shows us the price where market closed. Opening and closing the market doesn't mean that market literally open for trading and closed for the day, but instead, if you are taking that 5 minutes into consideration, take the first second as the opening of the market and the 4:59the second as the closing of the market, and so on and so forth this will continue. Now, there is another horizontal line connected to the upper and lower lines of the candle. The vertical line's top shows the highest price of that Cryptocurrency. Similarly the vertical line touching the lower most horizontal line shows the lowest price of that cryptocurrency exchange. Let's take a look at the below image to understand this.
Trendlines
Trend lines show us the overall trend in that particular market. From left to right, if the line is ascending, then that's a positive trend line showing that the market is marked by Bull Market. And if the line is descending, then it shows that the market is marked by Bear Market. Trend line usually connects the pivot points of all the prices pointed at given time intervals, and forms a rising or falling tide. Here's the example of trend lines.
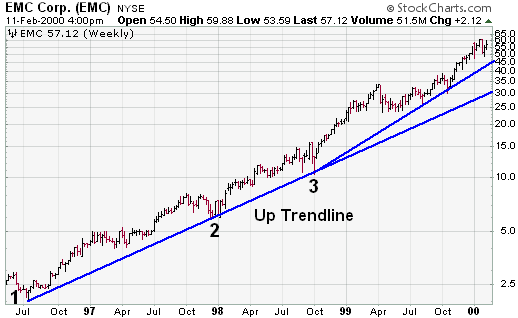
Image Credit - Representation of Increasing/Positive/Up Trend Line
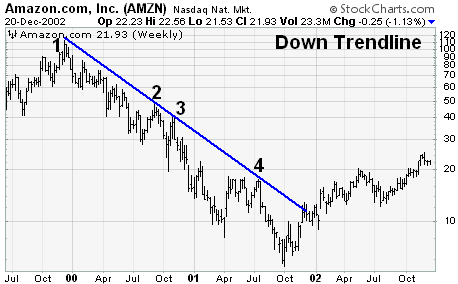
Image Credit - Representation of Decreasing/Negative/Down Trend Line
For now, that's all folks. I hope this article helped you in understanding certain important things. I'll keep on posting in this series as I move forward with my learnings. If you find anything wrong in this article, please comment and let me know so that I can correct myself.
Thanks for tuning in. If you liked the article, give it an upvote. Follow me or comment on this article if you have any questions or find any mistakes. Spread the word by sharing the article with your friends to expand knowledge.
-- Will be continued --
Don't forget most crypto currency's do well early on and level off for a long time after that. The reason being is there is a lot of people trying to get rich quick on a coins launch. You can see this with the current Steem price.
Correctly stated. I wanted to mention that, but I guess people already know that much. 80% of the people enter crypto trading with "get-rich-quick-and-become-bill-gates " mentality. But they eventually understand with experience. I guess even if I tell them, this lesson will only be learned with self-experience..
Thank you for the input.. :)
Thank you! This is what I need!
You're welcome.. Stay tuned, more coming soon.. ^^
Very informative post!
Glad you liked it.. I'll be posting more.. ^^
Yay! If there was some way to create a notification when a certain author posts, I would create one. I know a little about the terminologies but it's nice to see a detailed article fully dedicated to crypto currencies .
Looking forward to your coming posts.
Thank you so much.. ^^
I'll personally ping you on steemchat when I post further in this series.. :)
Nice tutorial for the newcomers in crypto.