ACTIVE LAST 7 DAYS / STEEM PRICE COMPARISON ....... STEEMIT NEWS FLASH :.............

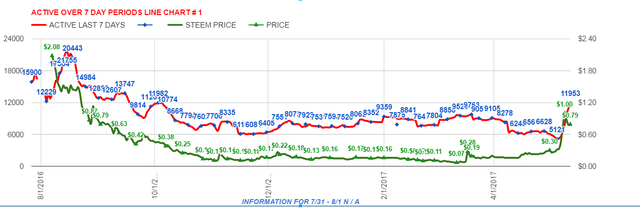
🐒 5 / 12 / 2017 - 11:05 PM EST STEEMIT NEWS FLASH : Active last 7 days daily line and Steem price comparison chart ( chart # 1 )
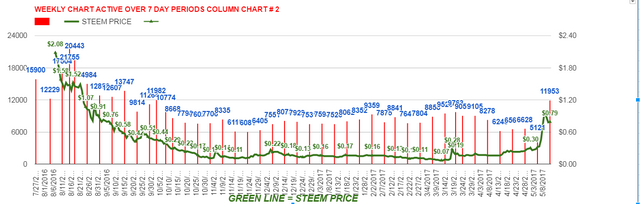
Active last 7 days weekly column and Steem price comparison chart ( chart # 2 )
I like applying data to charts . By applying data to charts it can reveal a much clearer picture .
CHART # 1 LINE CHART DAILY
RED LINE = Active last 7 days DAILY
GREEN LINE = Steem Price
🐒
CHART # 2 COLUMN CHART WEEKLY
RED COLUMN = Active last 7 days WEEKLY
GREEN LINE = Steem Price
🐒
SUMMARY :
Active users are beginning to increase .
🐒
DISCLAIMER : This content is for informational, educational and research purposes only.
Please get the advice of a competent financial advisor before investing your money in any financial instrument.
It is strongly recommend that you consult with a licensed financial professional before using any information provided here at STEEMIT NEWS FLASH . Any market data or news commentary used here is for illustrative and informational purposes only.
SUMMARY :
Active users are beginning to increase .
🐒
This post has been ranked within the top 50 most undervalued posts in the first half of May 13. We estimate that this post is undervalued by $9.92 as compared to a scenario in which every voter had an equal say.
See the full rankings and details in The Daily Tribune: May 13 - Part I. You can also read about some of our methodology, data analysis and technical details in our initial post.
If you are the author and would prefer not to receive these comments, simply reply "Stop" to this comment.