THE WEEKLY STEEMIT BULL REPORT

THE STEEMIT BULL REPORT , I will be posting THE STEEMIT BULL REPORT weekly.First and foremost I would like the community to know that I think this STEEMIT idea is absolutly genious ,and I applaud the developers for the work they have put into this.I also want the community to know that I want very much for STEEMIT to succeed.In the STEEMIT BULL REPORT i will be examinaning different data and giving my opinion as a long term invester .Therefore As a long term investor I will be pointing out data that I feel is important and needs to be followed.Some of the data will look good for investing in STEEMIT and some will not.I will be sharing the good and the bad and yes even the ulgy with you.
So let's dig right into some of the data.
.
Question: How much investment does it take to be a level Dust,newbie,user, superuser , Hero , Superhero , legend
.
Answer: That depends on the day
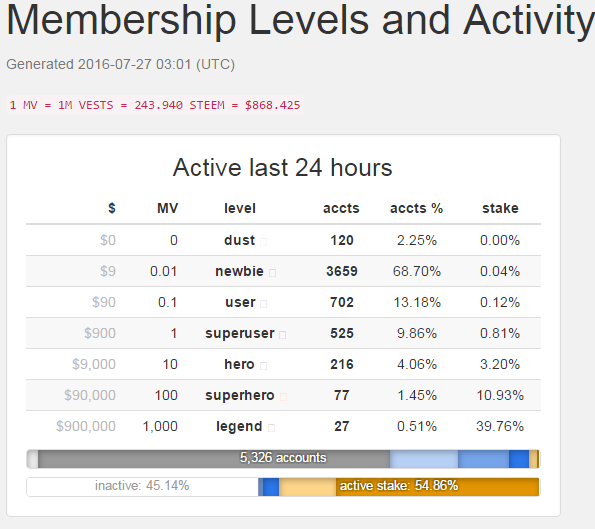
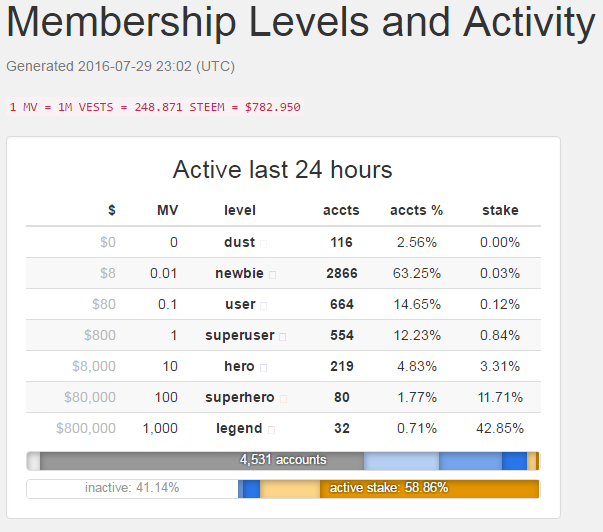
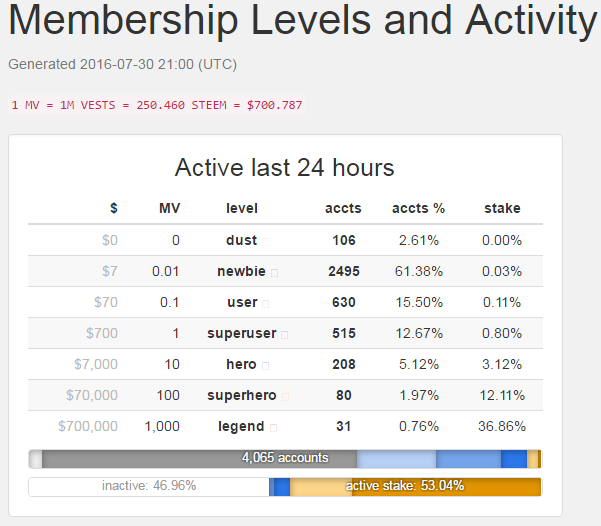
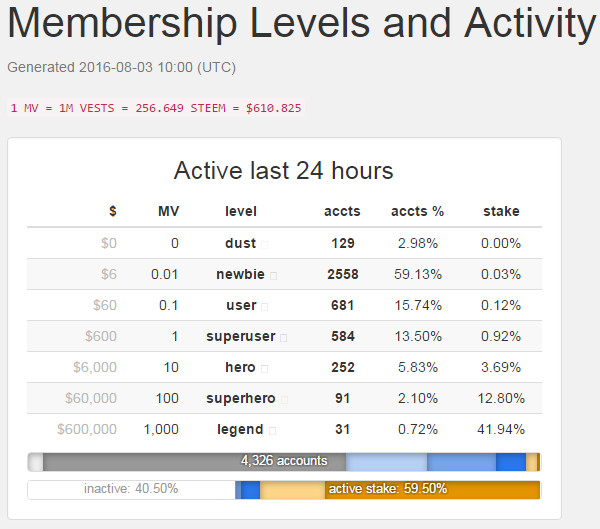
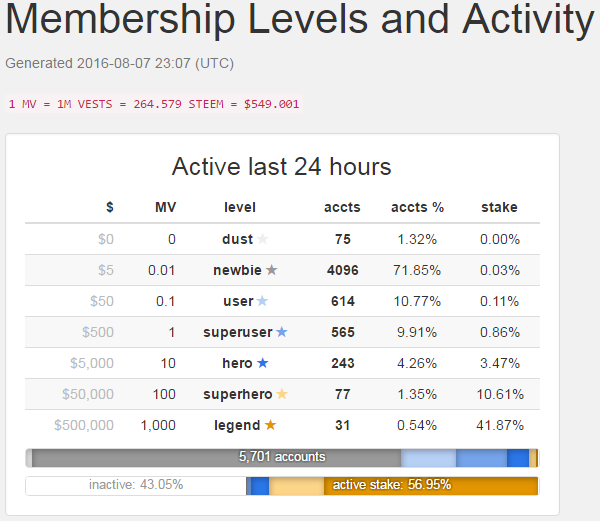
Here are some screen shots starting with 7/27/2016 and ending with 8/7/2016 , keep an eye on the $ column.
.
.
.
.
.
.
As you can see The investment amount keeps getting lower. AS an example we will look at the Superhero on 7/27/2016
$9,000 to $90,000....... Made you a Superhero,# of Superheroes = 77
.
7/29/2016
$8,000 to $80,000........Made you a Superhero,# of Superheroes = 80
.
7/30/2016
$7,000 to $70,000........Made you a Superhero,# of Superheroes = 80
.
8/3/2016
$6,000 to $60,000.......Made you a Superhero,# of Superheroes = 91
.
8/7/2016
$5,000 to $50,000.......Made you a Superhero,# of Superheroes = 77
.
Question : What does this mean when one is looking to make a long term investment
.
Answer: It would appear that by lowering the amount to be in each level group the numbers in each group have stayed relatively the same. By doing this it makes everything appear to be doing fine. An investor may look at this as a red flag because on 7/27/2016 there were 77 Superheros and now on 8/7/2016 at a much lower $ figure there are still only 77 Superheros.
Now as someone who is looking to invest a large amount into STEEMIT ,one thing they will be looking for, is the $ dollar amount at each level to stabilize . And the number of active users in each level to increase. I will be posting other data in the coming weeks so be sure to follow.And as i said I will be showing the GOOD , BAD , and UGLY.I do this to hopefully help this community grow and identify problems that may exist so they can be remedied .
I would have to disagree with @pheonike , that info came from steemd.com and everything else on there looks exactly right to me they track every user, every post, every comment, every vote and every transaction. I would say it's accurate. I am not sure but I believe it is every thing that happens on the blockchain.
razorwave8 I Do believe you are correct
Just to let everyone know, those levels are not anything official. The were created by the maker of that site.
@pheonike I just read a reply from @smooth to a blog by @anonymint and in his reply he makes referance to steemd.com which is where my statistics were gathered and @smooth is a whale and if the statistics are good enough for him they are good enough for me.here @smooth reply to @anonymint
[-]smooth (8) · 3 hours ago
Good analysis of the overall money supply dynamics and clear explanations like this are badly needed since the system is complex and many do not understand it. Upvoted.
A small correction:
given that currently only 2% of the money supply is SD
They actually misspoke in the interview in stating 2%. Currently the outstanding supply of SBD (which can be found on steemd.com) is
"current_sbd_supply": "1876469.436 SBD",
That is less than 1% of the market cap of STEEM+SP+SBD.
Looked at another way, the blockchain is currently reporting:
"virtual_supply": "124634091.611 STEEM",
"current_supply": "123729768.992 STEEM",
virtual_supply is the total money supply if all the SBD were converted to STEEM at the current exchange rate. Again the difference here is <1%.
Good afternoon. Your article is very useful. I voted for you.