Accounts Powering Down OUT OF TOP 1000 <> <> STEEMIT NEWS FLASH <> <>

2 / 10 / 2017 - 5:05 PM EST STEEMIT NEWS FLASH :
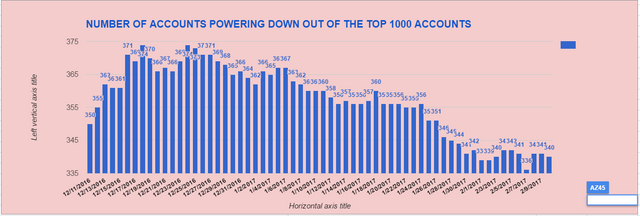
Number Of Accounts Powering Down Out Of Top 1000 Accounts since 12 / 11 / 2016 see ( chart # 1 )
.
Number Of Accounts Powering Down Out Of Top 1000 Accounts last 20 days see ( chart # 2 )
.
Number Of Accounts Powering Down Out Of Top 1000 Accounts since 12 / 11 / 2016 Column Chart see ( chart # 3 )
.
Accounts Powering Down numbers spreadsheet
The * = Number of days in a row Accounts Powering Down numbers have increased * =1 day , ** = 2 days , *** =3 days and so on .
.
| DATE | Number Powering Down |
|---|---|
| 12/11/2016 | 350 |
| 12/12/2016 | 355* |
| 12/13/2016 | 362** |
| 12/14/2016 | 361 |
| 12/15/2016 | 361 |
| 12/16/2016 | 371* |
| 12/17/2016 | 369 |
| 12/18/2016 | 374* |
| 12/19/2016 | 370 |
| 12/20/2016 | 366 |
| 12/21/2016 | 367* |
| 12/22/2016 | 366 |
| 12/23/2016 | 369* |
| 12/24/2016 | 374** |
| 12/25/2016 | 373 |
| 12/26/2016 | 371 |
| 12/27/2016 | 371 |
| 12/28/2016 | 369 |
| 12/28/2016 | 369 |
| 12/29/2016 | 368 |
| 12/30/2016 | 365 |
| 12/31/2016 | 366* |
| 1/01/2017 | 364 |
| 1/02/2017 | 362 |
| 1/03/2017 | 366* |
| 1/04/2017 | 365 |
| 1/05/2017 | 367* |
| 1/06/2017 | 367 |
| 1/07/2017 | 363 |
| 1/8/2017 | 362 |
| 1/9/2017 | 360 |
| 1/10/2017 | 360 |
| 1/11/2017 | 360 |
| 1/12/2017 | 358 |
| 1/13/2017 | 356 |
| 1/14/2017 | 357* |
| 1/15/2017 | 356 |
| 1/16/2017 | 356 |
| 1/17/2017 | 357* |
| 1/18/2017 | 360** |
| 1/19/2017 | 356 |
| 1/20/2017 | 356 |
| 1/21/2017 | 356 |
| 1/22/2017 | 355 |
| 1/23/2017 | 355 |
| 1/24/2017 | 356* |
| 1/25/2017 | 351 |
| 1/26/2017 | 351 |
| 1/27/2017 | 346 |
| 1/28/2017 | 345 |
| 1/29/2017 | 344 |
| 1/30/2017 | 341 |
| 1/31/2017 | 342* |
| 2/01/2017 | 339 |
| 2/02/2017 | 339 |
| 2/03/2016 | 340* |
| 2/04/2017 | 342** |
| 2/05/2017 | 342 |
| 2/06/2017 | 341 |
| 2/07/2017 | 336 |
| 2/08/2017 | 341* |
| 2/09/2017 | 341 |
| 2/10/2017 | 340 |
.
I like applying data to charts . By applying data to charts it can reveal a much clearer picture .
.
This data is compiled from @elyaque daily steem report
.
CHART # 1 LINE CHART DAILY
BLUE LINE = Number Of Accounts Powering Down Out Of Top 1000 Accounts
12 / 11 / 2016 to 2 / 10 / 2017
.

.
CHART # 2 LINE CHART DAILY
BLUE LINE = Number Of Accounts Powering Down Out Of Top 1000 Accounts
LAST 20 DAYS
.

.
CHART #3 COLUMN CHART
BLUE COLUMN = Number Of Accounts Powering Down Out Of Top 1000 Accounts
12 / 11 / 2016 to 1 / 23 / 2017
.

.
SUMMARY:
Applying data to charts can give a clear view of trends when they develop .
.
This post is being paid with 100% STEEM POWER ! ! ! ! !

POWER-UP 100% Image Credit @stephen.king989
DISCLAIMER : This content is for informational, educational and research purposes only.
Please get the advice of a competent financial advisor before investing your money in any financial instrument.
It is strongly recommend that you consult with a licensed financial professional before using any information provided here at STEEMIT NEWS FLASH . Any market data or news commentary used here is for illustrative and informational purposes only.
Please voice your opinions in the comments below.
If you find any of this information useful to you. Please upvote and follow. THANK YOU
A slow decline: prolly caused by STEEM's price remaining low.
Thanks for those data! :)
This looks promising :)
An additional thank you for this data
This is interesting tarzan wonder if its because of low steem value or less people on steemit, thanks for the support.