STEEM "<> <>" WATCHING FOR THE GOLDEN CROSS CHART PATTERN
🐒 Watching for the Golden Cross chart pattern for Steem.
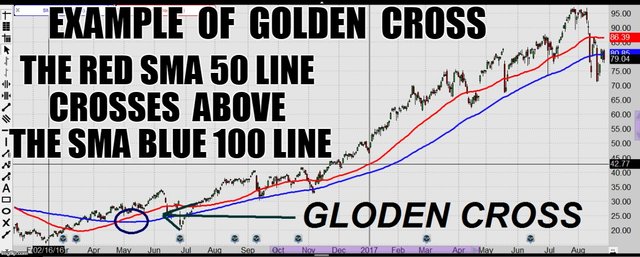
What is a 'Golden Cross'
The golden cross is a bullish breakout pattern formed from a crossover involving a security's ( or Cryptocurrency ) short-term moving average (such as the 50-day moving average) breaking above its long-term moving average (such as 100-day moving average) or resistance level. As long-term indicators carry more weight, the golden cross indicates a bull market on the horizon and is reinforced by high trading volumes.
Read more: Golden Cross http://www.investopedia.com/terms/g/goldencross.asp#ixzz4qhZSNYLA
🐒
🐒
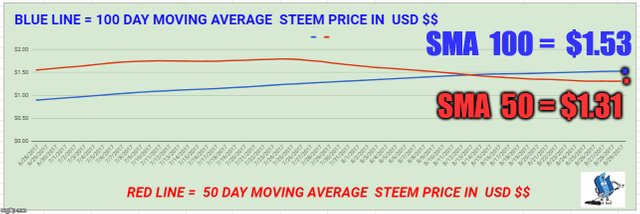
Below : STEEM PRICE
BLUE LINE : = 100 day Simple Moving Average of the price of Steem
RED LINE : = 50 day Simple Moving Average of the price of Steem
🐒
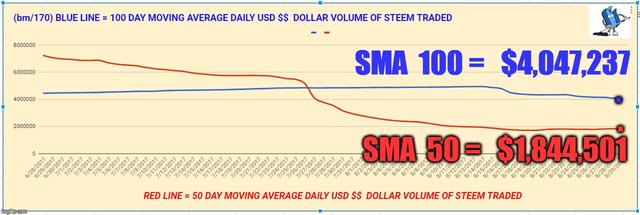
Below : USD $$ DOLLAR VOLUME OF STEEM TRADED
BLUE LINE : = 100 DAY MOVING AVERAGE DAILY USD $$ DOLLAR VOLUME OF STEEM TRADED
RED LINE : = 50 DAY MOVING AVERAGE DAILY USD $$ DOLLAR VOLUME OF STEEM TRADED
🐒
SUMMARY
🐒 The SMA 50 is below the SMA 100 on both charts .
.
🐒
DISCLAIMER :
This content is for informational, educational and research purposes only.
Please get the advice of a competent financial advisor before investing your money in any financial instrument.
It is strongly recommended that you consult with a licensed financial professional before using any information provided here . Any market data or news commentary used here is for illustrative and informational purposes only.
Trading involves a high level of risk. Future results can be dramatically different from the opinions expressed herein. Past performance does not guarantee future performance. Consult an investment professional before investing.
All ideas , trade signals , opinions and/or forecasts are for informational, educational and research purposes only and should not be construed as a recommendation to invest, trade, and/or speculate . Any investments made in light of these ideas, trade signals, opinions, and/or forecasts, expressed or implied herein, are committed at your own risk. I am not an investment advisor, information shared here is for informational, educational and research purposes only and not a recommendation to buy or sell anything .
🐒
Please voice your opinions in the comments below.
🐒 The SMA 50 is below the SMA 100 on both charts .
Thanks for sharing,i'm still new to this so i'm very grateful for the advice,will be definitely keeping my eye on it.
Great article!
Although chart "reading" is a set-by-step, learnable skill, once you've done it for years, like I have, you start to understand the "art" of it.
I'll be watching this along with you. Thanks for pointing it out.
sir you are great. i upvote you plaese upvote me.
god bless you.
Hi ,
Nice work sir
But, then it will be dumped again after Sunday. ;)
My two cents... Unless you're a day or swing trader, it makes life a lot easier when you ask yourself if you'll be upset in the future if you bought at $1.31 or $1.53 when Steem is potentially $10 or $20, etc.. Plus - you can be leveraging the Steem Power to make more money than you saved by waiting for the best purchase price.
While being rational, sometimes it's better to make the commitment and adjust after. Otherwise, average total cost it. The potential stress and wasted energy might not be worth the delta.
Even if you missed the ideal entry point to buy the most STEEM, this site is amazing because you can earn the difference on the platform with some smart work. This will lower your average total cost if that's important to you. As they say on Gemini's Exchange, "Onward & Upward!"
Thanks for this info @me-tarzan.
Hopefully we see a great increase in steem price soon