STEEM PRICE TRENDS USING THE STEEMIT OSCILLATOR ( 1 ) AND ( 2 )
11 / 13 / 2016
THE ME-TARZAN STEEMIT OSCILLATOR Developed to hopefully help to identify steem price trends . Only time will tell how well the oscillator will work . The oscillator is a @me-tarzan proprietary system .
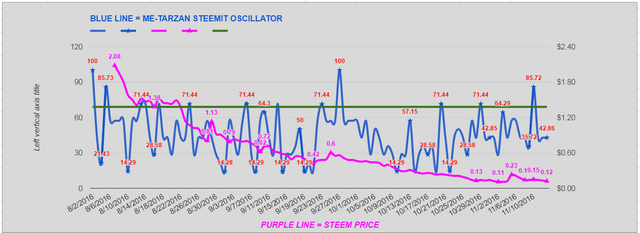
How does it work : The BLUE LINE is the actual oscillator that can move between 0 and 100 . The lowest reading is 0 and the highest reading is 100 on the oscillator . The PURPLE LINE is the steem price . The GREEN LINE is the Bull Bear Line . When the blue oscillator line is above 69 ( GREEN LINE ) for several days the trend for steem price should begin an uptrend . When the blue oscillator line is below 69 ( GREEN LINE ) for several days the trend for steem price should begin a downtrend .
ME-TARZAN STEEMIT OSCILLATOR
BLUE LINE = ME-TARZAN STEEMIT OSCILLATOR
PURPLE LINE = STEEM PRICE
GREEN LINE = OSCILLATOR BULL BEAR LINE
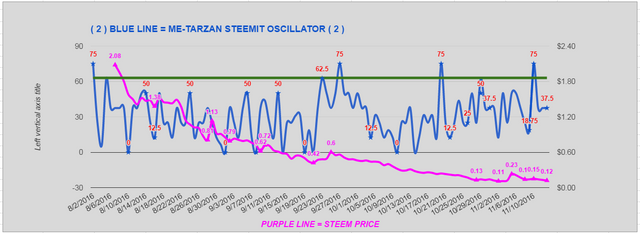
ME-TARZAN STEEMIT OSCILLATOR ( 2 ) I have added a second oscillator . The ME-TARZAN STEEMIT OSCILLATOR ( 2 ) has a few different data inputs than the original . Works just like the original except the Bull Bear ( GREEN LINE ) is set at 63 . Remember this second oscillator has some different data .
ME-TARZAN STEEMIT OSCILLATOR ( 2 )
BLUE LINE = ME-TARZAN STEEMIT OSCILLATOR ( 2 )
PURPLE LINE = STEEM PRICE
GREEN LINE = OSCILLATOR ( 2 ) BULL BEAR LINE
.
SUMMARY
ME-TARZAN STEEMIT OSCILLATOR is below the Bull Bear Line today .
ME-TARZAN STEEMIT OSCILLATOR ( 2 ) is below the Bull Bear Line today .
Both Oscillators remain in BEAR TERRITORY
I think If the blue oscillator line can get several days above the GREEN Bull Bear Line the steem price should stabilize and could begin an uptrend . As you can see the oscillator has been in bear territory for awhile now .
DISCLAIMER : This content is for informational, educational and research purposes only.
Please get the advice of a competent financial advisor before investing your money in any financial instrument.
It is strongly recommend that you consult with a licensed financial professional before using any information provided here . Any market data or news commentary or the ME-TARZAN STEEMIT OSCILLATOR or the ME-TARZAN STEEMIT OSCILLATOR ( 2 ) used here is for illustrative and informational purposes only.
To try to help with the Liquid Steem problem this post is being paid with 100% STEEM POWER ! ! ! ! !

100% POWER UP Image Credit @stephen.king989
Please voice your opinions in the comments below.
If you find any of this information useful to you. Please upvote and follow. THANK YOU
We got a one day pop above the Bull Bear Line on November 10 but as usual just for one day . We need several days above the Bull Bear Line to hopefully stabilize Steem price and start an uptrend .
Hoping for some positive from the coming hardfork...
Thanks for these reports.
glad you like them
We are all waiting for this triangle to break to the upside.
Thanks for keeping us updated me-tarzan
you are welcome spinbunny
I have detected your disclaimer
vegascomic LOL yes and I would put it in LARGE RED LETTERS if I knew how .
seems like the blue line has had higher lows since about 10/13 on both charts....indicative of price going sideways if not up??
Easy upvote..!! Shared also on Twitter✔. Thanks again for another great set of stats. Stephen
https://twitter.com/StephenPKendal/status/797869469737615360
Disclaimer: I am just a bot trying to be helpful.
This post has been ranked within the top 80 most undervalued posts in the second half of Nov 13. We estimate that this post is undervalued by $4.99 as compared to a scenario in which every voter had an equal say.
See the full rankings and details in The Daily Tribune: Nov 13 - Part II. You can also read about some of our methodology, data analysis and technical details in our initial post.
If you are the author and would prefer not to receive these comments, simply reply "Stop" to this comment.