Accounts Powering Down <> <> STEEMIT NEWS FLASH <> <>

1 / 23 / 2017 - 9:45 AM EST STEEMIT NEWS FLASH :
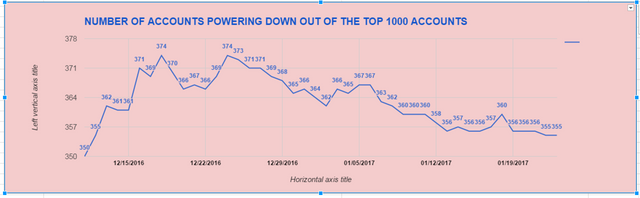
Number Of Accounts Powering Down Out Of Top 1000 Accounts since 12 / 11 / 2016 see ( chart # 1 )
.
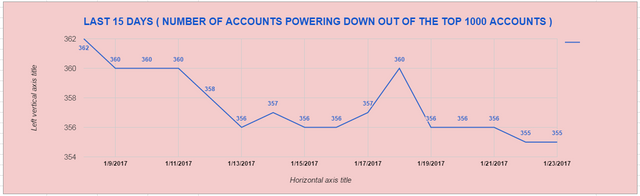
Number Of Accounts Powering Down Out Of Top 1000 Accounts last 15 days see ( chart # 2 )
.
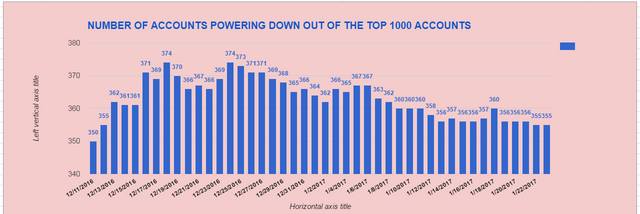
Number Of Accounts Powering Down Out Of Top 1000 Accounts since 12 / 11 / 2016 Column Chart see ( chart # 3 )
.
Accounts Powering Down numbers spreadsheet
The * = Number of days in a row Accounts Powering Down numbers have increased * =1 day , ** = 2 days , *** =3 days and so on .
.
| DATE | Number Powering Down |
|---|---|
| 12/11/2016 | 350 |
| 12/12/2016 | 355* |
| 12/13/2016 | 362** |
| 12/14/2016 | 361 |
| 12/15/2016 | 361 |
| 12/16/2016 | 371* |
| 12/17/2016 | 369 |
| 12/18/2016 | 374* |
| 12/19/2016 | 370 |
| 12/20/2016 | 366 |
| 12/21/2016 | 367* |
| 12/22/2016 | 366 |
| 12/23/2016 | 369* |
| 12/24/2016 | 374** |
| 12/25/2016 | 373 |
| 12/26/2016 | 371 |
| 12/27/2016 | 371 |
| 12/28/2016 | 369 |
| 12/28/2016 | 369 |
| 12/29/2016 | 368 |
| 12/30/2016 | 365 |
| 12/31/2016 | 366* |
| 1/01/2017 | 364 |
| 1/02/2017 | 362 |
| 1/03/2017 | 366* |
| 1/04/2017 | 365 |
| 1/05/2017 | 367* |
| 1/06/2017 | 367 |
| 1/07/2017 | 363 |
| 1/8/2017 | 362 |
| 1/9/2017 | 360 |
| 1/10/2017 | 360 |
| 1/11/2017 | 360 |
| 1/12/2017 | 358 |
| 1/13/2017 | 356 |
| 1/14/2017 | 357* |
| 1/15/2017 | 356 |
| 1/16/2017 | 356 |
| 1/17/2017 | 357* |
| 1/18/2017 | 360** |
| 1/19/2017 | 356 |
| 1/20/2017 | 356 |
| 1/21/2017 | 356 |
| 1/22/2017 | 355 |
| 1/23/2017 | 355 |
.
I like applying data to charts . By applying data to charts it can reveal a much clearer picture .
.
This data is compiled from @elyaque daily steem report
.
CHART # 1 LINE CHART DAILY
BLUE LINE = Number Of Accounts Powering Down Out Of Top 1000 Accounts
12 / 11 / 2016 to 1 / 23 / 2017
.
.
CHART # 2 LINE CHART DAILY
BLUE LINE = Number Of Accounts Powering Down Out Of Top 1000 Accounts
LAST 15 DAYS
.
.
CHART #3 COLUMN CHART
BLUE COLUMN = Number Of Accounts Powering Down Out Of Top 1000 Accounts
12 / 11 / 2016 to 1 / 23 / 2017
.
.
SUMMARY:
Applying data to charts can give a clear view of trends when they develop .
The number of accounts Powering Down look to be stabilized
.
This post is being paid with 100% STEEM POWER ! ! ! ! !

POWER-UP 100% Image Credit @stephen.king989
DISCLAIMER : This content is for informational, educational and research purposes only.
Please get the advice of a competent financial advisor before investing your money in any financial instrument.
It is strongly recommend that you consult with a licensed financial professional before using any information provided here at STEEMIT NEWS FLASH . Any market data or news commentary used here is for illustrative and informational purposes only.
Please voice your opinions in the comments below.
If you find any of this information useful to you. Please upvote and follow. THANK YOU
This post has been ranked within the top 50 most undervalued posts in the second half of Jan 23. We estimate that this post is undervalued by $10.71 as compared to a scenario in which every voter had an equal say.
See the full rankings and details in The Daily Tribune: Jan 23 - Part II. You can also read about some of our methodology, data analysis and technical details in our initial post.
If you are the author and would prefer not to receive these comments, simply reply "Stop" to this comment.
As always great charts and great post Thank you for all you do here on steemit
You are very welcome and thank you for all your support spinbunny
Great charts, this is good info! Consider yourself followed.
thanks heymattsokol followed back
Thanks, that is great! It would be great if you could include the total number of steem being powered down as well. Thanks for the great info though, keep it up! :)
I will work on that for you thanks for your input jrcornel
Not sure if the data you listed above is only a sample, but the charts seem to reflect it is the complete dataset. It is very useful to visualize the numbers as you've done with these charts.
From a very brief examination the numbers, I can see they all lie between 350 and 374. That range represents approximately a 7% variation. Also, the absolute number of power downs is relatively constant, and as your charts point out it actually is in a downward trend.
I appreciate you bringing this data to the attention of the community, but please keep in mind some of this powering down is to fund the development team. What would be a great chart to see, is the % of power downs used to improve and expand the platform, in other words what % is being reinvested in making this platform even better.
That's not data you can obtain from the blockchain, but it would be interesting to know what that ratio is.
Another noteworthy statistic is that the number of accounts powering down compared with the total number of accounts is extremely small, only 0.2%. Out of the accounts active in the last 30 days it's just under 3%. Although that sounds great it's also important to realize the accounts powering down probably represent the those with the biggest stake as well, which is not so great.
Thats is very good information to know Thank you for your input full-steem-ahead
I would be very interested in knowing where to find the total number of accounts powering down and the total number powering up . If you know and could give me the link I would like to start compiling and charting this data. Thanks
I'm no steem expert. You probably know as much if not more than I on where to get steemit data. I just used your data list and steemd.com
Hope that helps.
Thanks for the analysis! Very good information. Keep sharing!
Thanks funnyman
Nice post/charts @me-tarzan. Did you notice more people actually looked at your post vs. others that have been put up with 3x the votes? Keep up the good work.
upvoted & resteemed
I had not noticed and I will say that is an impressive number .
Thank you for all your support @bluehorseshoe