ACTIVE LAST 7 DAYS / STEEM PRICE COMPARISON ....... STEEMIT NEWS FLASH :.............

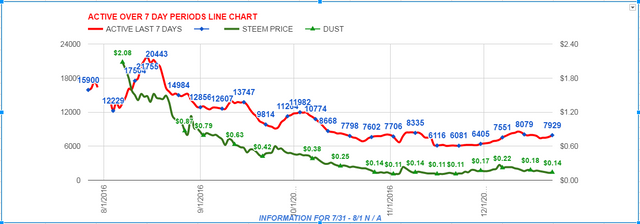
12 / 23 / 2016 - 8:40 AM EST STEEMIT NEWS FLASH : Active last 7 days daily line and Steem price comparison chart ( chart # 1 )
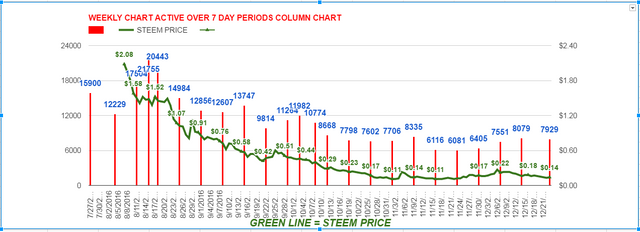
Active last 7 days weekly column and Steem price comparison chart ( chart # 2 )
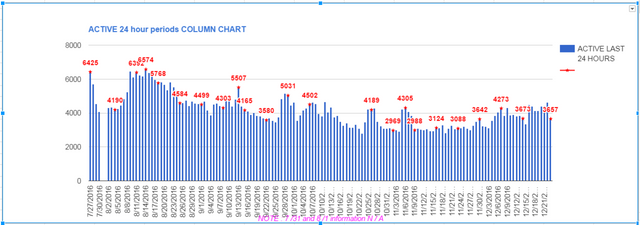
Active users over last 24 hours Chart # 3 .
I like applying data to charts . By applying data to charts it can reveal a much clearer picture .
CHART # 1 LINE CHART DAILY
RED LINE = Active last 7 days DAILY
GREEN LINE = Steem Price
.
CHART # 2 COLUMN CHART WEEKLY
RED COLUMN = Active last 7 days WEEKLY
GREEN LINE = Steem Price
.
CHART # 3 ACTIVE LAST 24 HOURS DAILY
BLUE COLUMN = Active last 24 hours
DISCLAIMER : This content is for informational, educational and research purposes only.
Please get the advice of a competent financial advisor before investing your money in any financial instrument.
It is strongly recommend that you consult with a licensed financial professional before using any information provided here at STEEMIT NEWS FLASH . Any market data or news commentary used here is for illustrative and informational purposes only.
This post is being paid with 100% STEEM POWER ! ! ! ! !

I got this 100% POWER UP logo from @stephen.king989
Please voice your opinions in the comments below.
If you find any of this information useful to you. Please upvote and follow. THANK YOU
SUMMARY :
Active last 7 days users seem to be in a consolidation phase .
SUMMARY :
Active last 7 days users seem to be in a consolidation phase .
Or people are not using bots or alt accounts to post as much
Thanks for your input matrixdweller