<<>> STEEM PRICE TRENDS USING THE STEEMIT OSCILLATOR ( 1 ) AND ( 2 ) <<>>
🐒 APRIL 12 , 2017
THE ME-TARZAN STEEMIT OSCILLATOR ( 1 ) Developed to hopefully help to identify steem price trends . Only time will tell how well the oscillator will work . The oscillator is a @me-tarzan proprietary system .
How does it work : The BLUE LINE is the actual oscillator that can move between 0 and 100 . The lowest reading is 0 and the highest reading is 100 on the oscillator . The PURPLE LINE is the steem price . The GREEN LINE is the Bull Bear Line . When the blue oscillator line is above 69 ( GREEN LINE ) for several days the trend for steem price should begin an uptrend . When the blue oscillator line is below 69 ( GREEN LINE ) for several days the trend for steem price should begin a downtrend .
🐒
NOTE : The blue oscillator line for both oscillators ( 1 ) and ( 2 ) need to stay 4 consecutive days above the GREEN Bull Bear Line for steem price to begin an uptrend .
🐒
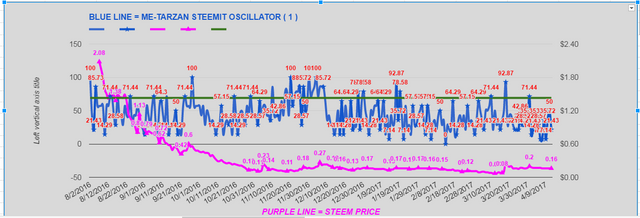
ME-TARZAN STEEMIT OSCILLATOR ( 1 )
BLUE LINE = ME-TARZAN STEEMIT OSCILLATOR ( 1 )
PURPLE LINE = STEEM PRICE
GREEN LINE = OSCILLATOR ( 1 ) BULL BEAR LINE
8/2/2016 to 4/12/2017
🐒
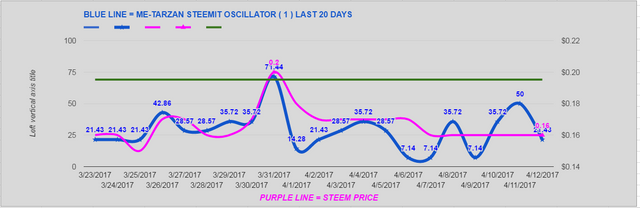
ME-TARZAN STEEMIT OSCILLATOR ( 1 ) The chart below = last 20 days . Easier to see what has taken place the last 20 days .
🐒 🐒
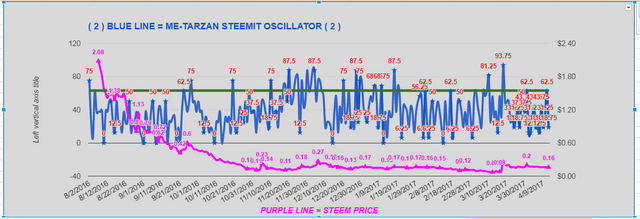
ME-TARZAN STEEMIT OSCILLATOR ( 2 ) I have added a second oscillator . The ME-TARZAN STEEMIT OSCILLATOR ( 2 ) has a few different data inputs than the original . Works just like the original except the Bull Bear ( GREEN LINE ) is set at 63 . Remember this second oscillator has some different data .
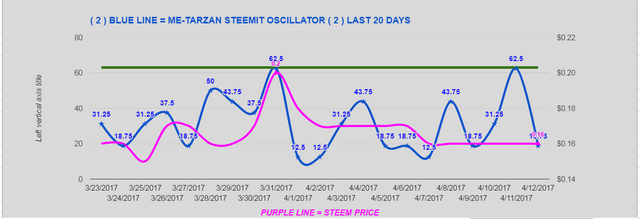
ME-TARZAN STEEMIT OSCILLATOR ( 2 )
BLUE LINE = ME-TARZAN STEEMIT OSCILLATOR ( 2 )
PURPLE LINE = STEEM PRICE
GREEN LINE = OSCILLATOR ( 2 ) BULL BEAR LINE
8/2/2016 to 4/12/2017
🐒
ME-TARZAN STEEMIT OSCILLATOR ( 2 ) The chart below = last 20 days . Easier to see what has taken place the last 20 days .
🐒 🐒
SUMMARY
Both oscillators are below the Bull Bear Line .
I would like to see both oscillators in Bull territory for 4 consecutive days . We still have not had that happen .
I think If the blue oscillator line for both oscillators can stay 4 consecutive days above the GREEN Bull Bear Line the steem price should stabilize and begin an uptrend .
🐒
DISCLAIMER : This content is for informational, educational and research purposes only.
Please get the advice of a competent financial advisor before investing your money in any financial instrument.
It is strongly recommend that you consult with a licensed financial professional before using any information provided here . Any market data or news commentary or the ME-TARZAN STEEMIT OSCILLATOR ( 1 ) or the ME-TARZAN STEEMIT OSCILLATOR ( 2 ) used here is for illustrative and informational purposes only.
🐒
This post is being paid with 100% STEEM POWER ! ! ! ! !

100% POWER UP Image Credit @stephen.king989
Please voice your opinions in the comments below.
If you find any of this information useful to you. Please upvote and follow. THANK YOU
Both oscillates still in bear country .
NO BUY SIGNAL yet
This post has been ranked within the top 50 most undervalued posts in the second half of Apr 12. We estimate that this post is undervalued by $0.57 as compared to a scenario in which every voter had an equal say.
See the full rankings and details in The Daily Tribune: Apr 12 - Part II. You can also read about some of our methodology, data analysis and technical details in our initial post.
If you are the author and would prefer not to receive these comments, simply reply "Stop" to this comment.