It's growing like gang busters, that's for sure. Does anyone know a way to measure active users? For example, how many have logged in the last month. I suppose logins are not registered on the block chain, but all actions are: posts, comments, upvotes, etc. It would be interesting to see whether active users is growing. That is the important metric. If the rate of attrition is greater than the rate of sign up then that is obviously not so good.
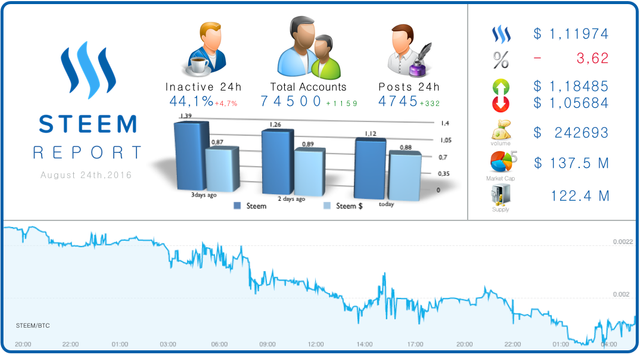
The number shows users which doesnt blog the last 24 hours, the number behind shows an increase or decrease from the day before. If you check the last Reports you can see the variation.
I think that I have missed something...so if I sold the Steem dollars in my account 2 weeks ago I would have received say $100 and at $2 / STEEM I could have bought 50 STEEM. but today at $1.10 /STEEM my Steem Dollars would be about $90 but I could buy 81 STEEM...( these figurenot 100%) but does this sound about right?
beim ersten Hinschauen hatte ich Deine 3 Balkendiagramme jeweils mit den 3 Personen-Icons assoziiert, und dachte, heiliger Strohsack, soviel weniger Accounts und Posts in den letzten Tagen :-)
Sorry but as a newbie to all of this including bitcoin etc . I dont understand . Please explain in layman's terms what does this mean exactly? THANKS! ☺
Sorry i find it all very confuseing ! Can you please explain the graph to me so its easier to understand. I know nothing even about the stock market so im just looking for a simplified explanation i guess. Lol! And theres a dark blue steem and a light blue steem side by side. I just dont get it sorry...maybe you could another post on this more simplified for us dummies! Lol, ! Call it" steemit for dummies! "
Ok, no problem. First if you dont understand the BTC
chart you can see my live Chart in Dollar at http://steemchart.com.
The Steem bars side by side is the steemprice in Dollars, 3 days ago ( 1,39$ ) , then the middle one 2 days ago ( 1,26 $ ) and the last one which is today ( 1,12$ ) . It shows that the Steemprice is going down at the moment. The other one shows the Steem Dollar in the same way. This one is stable at arround 0,9 $.
great updates, im guessing steem will hit 100k user accounts by first week of September. by that time, traders will have to prepare for the bull run.
I hope it will be like that :) Today we will hit 75000 Users !
It's growing like gang busters, that's for sure. Does anyone know a way to measure active users? For example, how many have logged in the last month. I suppose logins are not registered on the block chain, but all actions are: posts, comments, upvotes, etc. It would be interesting to see whether active users is growing. That is the important metric. If the rate of attrition is greater than the rate of sign up then that is obviously not so good.
The number shows users which doesnt blog the last 24 hours, the number behind shows an increase or decrease from the day before. If you check the last Reports you can see the variation.
Just did a quick graph by myself to show the last 7 Days
I think that I have missed something...so if I sold the Steem dollars in my account 2 weeks ago I would have received say $100 and at $2 / STEEM I could have bought 50 STEEM. but today at $1.10 /STEEM my Steem Dollars would be about $90 but I could buy 81 STEEM...( these figurenot 100%) but does this sound about right?
Yes thats right.
OH ! OK! Thanks!
Hallo elyaque,
beim ersten Hinschauen hatte ich Deine 3 Balkendiagramme jeweils mit den 3 Personen-Icons assoziiert, und dachte, heiliger Strohsack, soviel weniger Accounts und Posts in den letzten Tagen :-)
ne, ne Gott sei dank nicht :) Danke fuers upvoten. Wie findest die neue Seite http://steemchart.com ?
Sorry but as a newbie to all of this including bitcoin etc . I dont understand . Please explain in layman's terms what does this mean exactly? THANKS! ☺
What exactly you like to know?
Sorry i find it all very confuseing ! Can you please explain the graph to me so its easier to understand. I know nothing even about the stock market so im just looking for a simplified explanation i guess. Lol! And theres a dark blue steem and a light blue steem side by side. I just dont get it sorry...maybe you could another post on this more simplified for us dummies! Lol, ! Call it" steemit for dummies! "
Ok, no problem. First if you dont understand the BTC
chart you can see my live Chart in Dollar at
http://steemchart.com.
The Steem bars side by side is the steemprice in Dollars, 3 days ago ( 1,39$ ) , then the middle one 2 days ago ( 1,26 $ ) and the last one which is today ( 1,12$ ) . It shows that the Steemprice is going down at the moment. The other one shows the Steem Dollar in the same way. This one is stable at arround 0,9 $.
If you have any further Questions, let me know.
OH OK THANKS!
Are you expecting it to go back up soon!?
I hope its going up soon, but who knows? Right now its going sideways.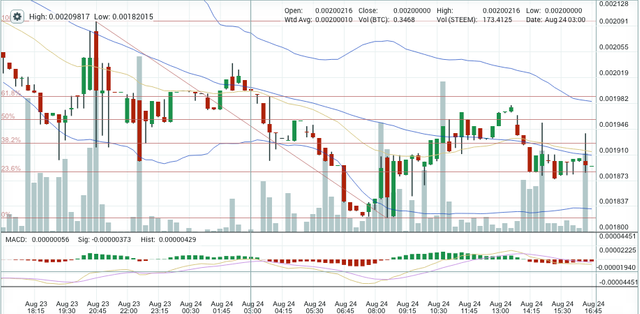
Thanks for sharing this article! - Danke für das Teilen dieses Artikels! Jonas Ahrens
Aber gerne doch :) Wenn was unklar ist einfach melden.
Live Charts gibts auf meiner neuen Webseite . http://steemchart.com/