GitHub Repository Visualizations for Steem, Steemit, and Synereo …
Screenshot courtesy of http://codeology.braintreepayments.com
A GitHub visualizer is a software tool that parses metadata from a specified GitHub repository and uses it to display various graphs, images, and statistics. This can sometimes give insight into a particular repository. I do not pretend to be an expert in anaylizing the output from these visualizers, but thought it might be of interest to the Steemit community. Note that these are not the only GitHub visualizers.
Also, I just chose the Steem, Steemit, and Synereo GitHub repositories for illustrative purposes. You can choose any known public GitHub user.
Enjoy!
DISCLAIMER: I'm not the author of these GitHub visualizers.
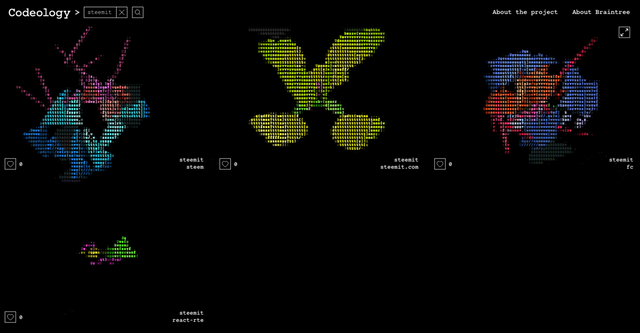
Codeology
Codeology is an open-source project that reimagines code by bringing it to life visually. The combination of coding languages in each GitHub project determines its look, therefore, each creation is original. The application pulls data from GitHub’s public API and creates visuals using WebGL, Three.js, and GLSL Shaders. Shape and color represent an individual language, with size being proportionate to how many characters of code were written.
artzub GitHubVisualizer
Visualization of the history of repository changes based on data from GitHub. You can see the programming languages used for each repository, along with many other GitHub Statistics (e.g. Short description of each repository, the last commit, etc).
COOL!
the links are all down!
Hi @ackza, I tried all three links just now and they work for me. BTW, these repos aren't owned or managed by me, I just stumbled across them way back when.