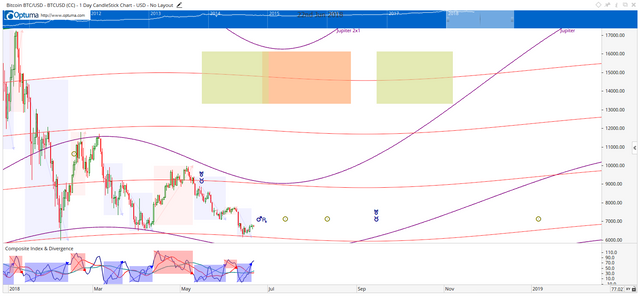
Bitcoin will begin a trend reversal between June 22nd and July 7th.
Time is the cause of all trend changes.
Time is the reason for trend changes and price action.
- Trends do not change due to sentiment.
- Trends do not change due to news.
- Trends do not change due to Tweets.
- Trends do not change due to dynamic areas of support and resistance.
- Trends do not change due to a moving average crossover.
- Trends do not change due to oscillators being in elevated conditions.
- Trends do not change due to trend lines.
Trends change because of set pattern in time.
- Trends change due to a set path and pattern that Man can not deviate from; we are slaves to this pattern.
- The pattern that price follows is as static and natural as anything in nature: the rotation of the planets, the Fibonacci ratio, the sun rising in the east and setting in the west.
You can believe or not believe, but Gann believed God created all of Creation. Gann also concluded that it was impossible for there to be randomness in nature or in human behavior, that a God who created everything must have a supreme order and logic to His creation.
June 22nd - Jul7th is where we will see a reversal beginning in Bitcoin. When the dynamic angular and Square time cycles, that have been applied to price, fail to initiate reversal points, the static time cycles WILL. June 22nd - July 7th is one of those static time cycles.
Consider the following as well:
July 1st - Uranus (the harbinger of change in financial markets) exits Taurus (Taurus, the bull, is the money and stock market) indicating a change.
June 26th - One of the most important things to watch this year: Mars Retrograde cycle - Bitcoin is very sensitive to anything with Mars. Gann said Mars is the 'trigger' for trends and activity.
That is nic topic for me because I am interested in Bitcoin and this history was again and again for past few years so let's see for pump Bitcoin again. and that is a chart for history for Bitcoin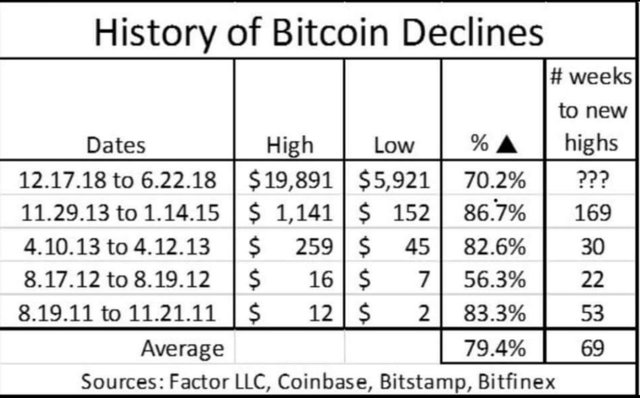
It's a great chart
Thank you so much @captainquenta.
your research is good . will help so many people
thank you!
yes of course
Absolutely
Totally accurate. This resonates so much with me because i am a forex trader using a 'riding the trend strategy'... Thanks so much
You are right
thank you! I am a forex trader and educator as well as a cryptotrader
this is helpful information
I gave you an upvote on your post! Please give me a follow and I will give you a follow in return!
Please also take a moment to read this post regarding bad behavior on Steemit.
Your research good and helpful.
Will do that...
follow me and vote for me
This is right. Good work
I do agree with you about the casuses of trend changes..but I think they're not 100 percent right in cryptos...Fibonaci doesn't work that certain at least in short/middle term predictions...although your prediction is probable..
Thank you @captainquenta
Correct, Fibonacci ratios have too wide of a distribution of success and failure on anything lower than a weekly chart. But time cycles are constant and consistent in any market. For technical analysts, the advent of the cryptocurrency markets have given us a new market that shows that it moves and responds to cycles as accurately as any other market.
Your information is very useful and analistic
totally true.thank you for this post
Hey man, we are waiting for it from so long.Hopefully this time it will reverse