Bitcoin Bull Reversal Sighted, But Momentum Proves Weak
Bitcoin bulls seem to have gained an upper hand, but the cryptocurrency is still struggling to find follow-through buying today.
On Wednesday, CoinDesk's Bitcoin Price index (BPI) closed (as per UTC) 5.15 percent higher at $11,399. The positive close above $11,000 adds credence to the solid defense of the $10,000 mark seen earlier this week.
That said, the follow-through is not necessarily encouraging.
The BPI clocked a high of $11,711 at 03:59 UTC today before falling back below $11,200. As of writing, the BPI stands at $11,350. The cryptocurrency has appreciated by 3 percent in the last 24 hours, says data source OnChainFX.
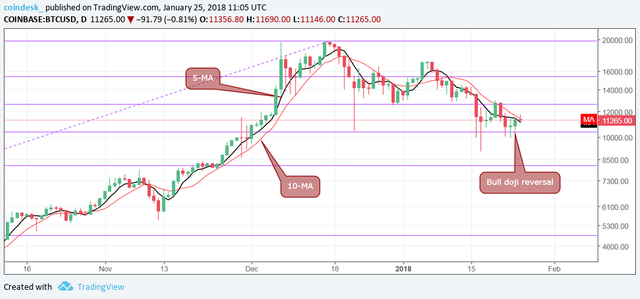
The bullish doji reversal at the key support of $10,391.02 (50 percent Fibonacci retracement of 2017 low to 2017 high) validates the argument that BTC has built a base around $10,000 and points to a short-term bearish-to-bullish trend change.
The 5-day MA and 10-day MA carry a bearish bias and could limit the upside in BTC.
A bullish doji reversal occurs when a doji candle (as seen on Tuesday) is followed by a positive price action (yesterday's 5 percent gain).
So, the short-term outlook is bullish. Still, there is merit in being cautious.
Comments on social media indicate the investor community is not convinced by previous day's bullish price action and wants to see a sustained move above $11,500 before calling a bottom. The argument has substance says the chart below.
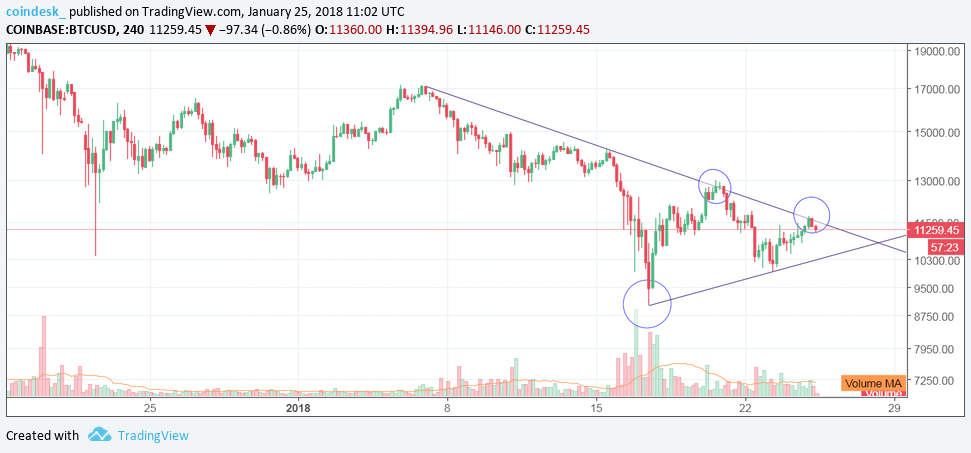
The above chart (prices as per Coinbase) shows-
Bitcoin witnessed a solid recovery on Jan. 17 from the low of $9,005 on the back of strong volumes.
However, volumes have dropped in the subsequent days. This could be the reason behind bitcoin's failure to rise above the falling trendline hurdle on Jan. 20 and Jan. 21.
BTC has had another go at the trendline resistance today, but once again volumes remain low.
Higher lows as represented by the rising trendline.
View
Bullish doji reversal was confirmed yesterday, but so far bitcoin has been unable to generate the follow through     necessary to declare that the bottoming process is complete.
Only a high volume break above the trendline resistance on the 4-hour chart would add credence to the bullish doji reversal and open doors for a sustained move higher to $13,000 and $14,250.
On the other hand, rejection at the falling trendline followed by a high volume drop below $10,300 (rising trendline support on the 4 - hour chart) could yield re-test of last week's low of $9,005.
That said, only a daily close (as per UTC) below $10,391.02 (50 percent Fibonacci retracement of 2017 low to 2017 high) would revive the bearish outlook.
Enjoy this useful information.
thanks and take care...