Steempunks.com v0.11 released

I've added four new metrics and significantly improved sparklines visualization for time of day dependent cards by removing today's aggregates and substituting them for aggregates for last 24 hour.
About data
- Sparklines x-axis starts from the minimum value, not from zero. here's why
- Last data point for metrics with
24 houris calculated using data (e.g. posts) for last 24 hours instead of data for today's calendar date
Steempunks.com
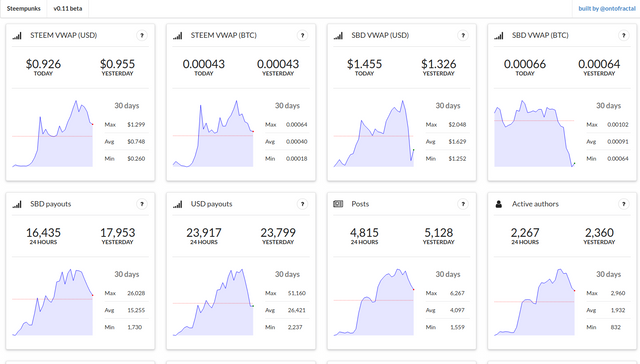
New metrics
- Average number of comments per post
- Average number of votes per post
- Share of 100% Steem Power posts
- New accounts (including inactive)
Tech stack
- Pipelinedb (postgres based)
- Postgrest
- Typescript
- React
- Mobx
- Elixir and Erlang/OTP
- Docker
- Semantic UI
Great work. Now the charts are very clear and digestible!
Your dev stack screams awesome.
Unfortunately, the app doesn't load for me in Chromium.
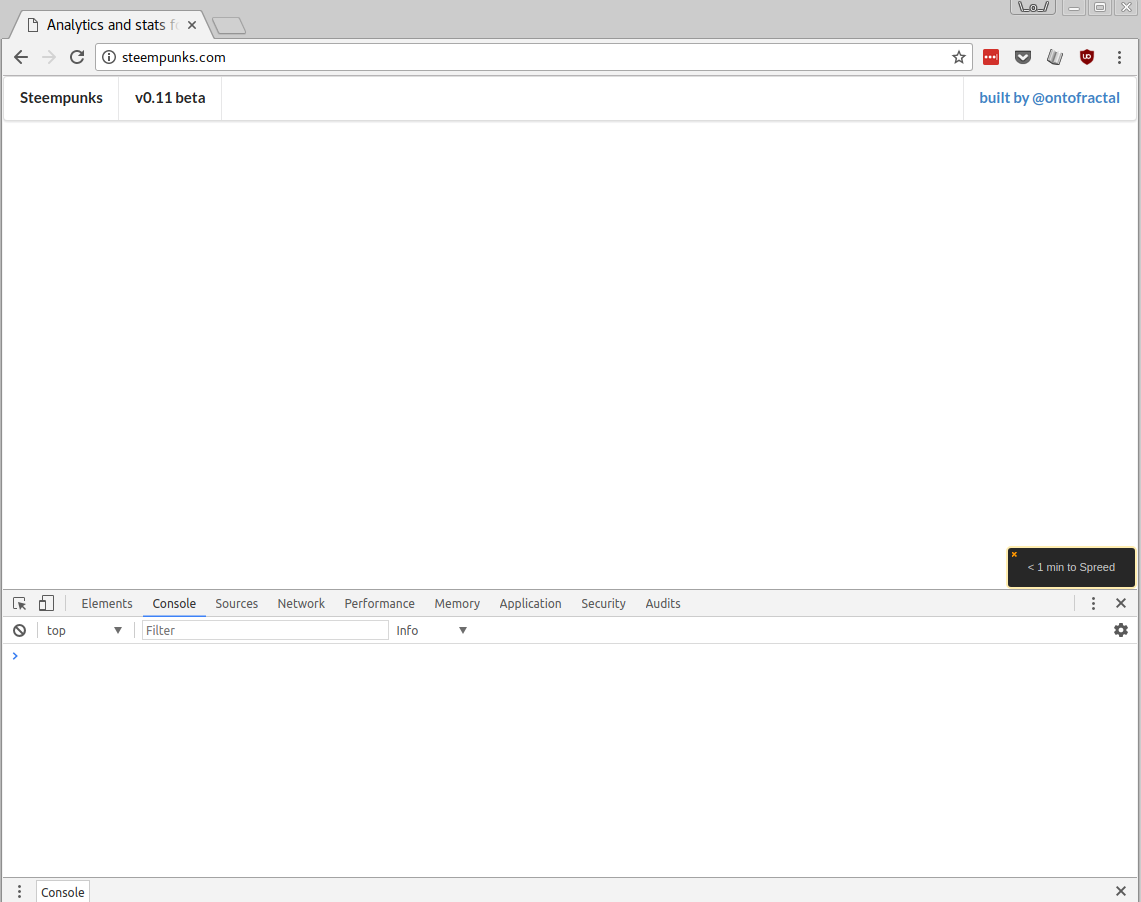
Yep, that was a backend caching issue, everything should work fine now.
This stack works really well for me, less frustration, more productivity.
Is the code on Github?
not yet, although I plan to open source it in the future
Great visualization with useful metrics. Thank you, Ontofractal. Following you :D
Thank you for providing this service - Its a great analysis tool!
thanks, @dez1337!
@ontofractal Love the new metrics man!