Steem Price Euphoria Running High - Time To Check Your Emotions Vs. The Charts
Just like everyone else I'm feeling that extra boost of energy from seeing the price of steem finally have a bounce. There is alot of rah-rah-rah about the price of steem going to the moon again. However, we have had bounces before and though I will embrace the moment we have to keep an eye on reality. The chart says it all.....
Price Action Tells The Tale
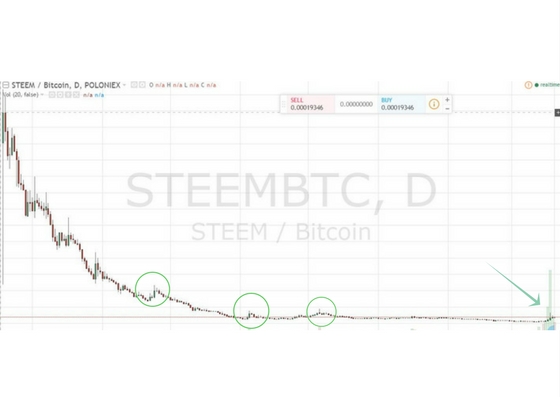
This is the daily chart of steem from the time it began trading on Poloniex. I have circled a few instances of short-term rises similar to what we are seeing now.
This time is not different until I see the price establish above those prior to highs and trade in a range near that third prior high.
Not trying to rain on anyone's parade, just don't want to see people get hurt.
Here's hoping we continue to push and breakout of this tight range we have been stuck in for too many months.
.jpg)
Look at the volume on this bounce compared to the others... "this time it's different"... famous last words :)
LMAO....yes famous last words indeed. I'll get excited when we start dancing with those prior tops. Been teased too many times before. ;-)
A very important reality check this is. I too have been excited about the recent price rise, but so far see no evidence that it's going to be different from the earlier spikes you pointed out. This seems like it was a well orchestrated pump and I have my buy orders placed lower down. I'll be happy if I'm wrong, but otherwise I'll be happy that I didn't pay too much for more Steem.
Could not have said it better.
This post has been ranked within the top 80 most undervalued posts in the first half of Mar 21. We estimate that this post is undervalued by $3.44 as compared to a scenario in which every voter had an equal say.
See the full rankings and details in The Daily Tribune: Mar 21 - Part I. You can also read about some of our methodology, data analysis and technical details in our initial post.
If you are the author and would prefer not to receive these comments, simply reply "Stop" to this comment.
I'm very ignorant, but according to your interpretation does this mean $0.12-0.14 is the next likely holding point?
I'm not really making a prediction on where it will go. More so just pointing out that we still need to breach the .00030-.00035 are before we can even consider that the price trend has reversed. At .00019 we can still have quite the move up % wise and still be in the same sideways range of stagnation.
I see, so the 20-22 cents didn't break it. (I guess that's why I thought the price would fall back?) I must learn more...
I mean technically that was a top, but it's essentially within this longer term range and the .30 to .35 area has multiple tops which makes it a stronger pivot point.
I see now. And I can see that on the chart. But I can't see why/where /how likely it will go to the lower point from the chart, am too ignorant...
It's all probabilities, no one truly knows. Either we test those highs or we pull back to the lows. I'm patiently waiting to see which, long term investment for me so not considered with day to day. Just overall trend.
Yes, I guess I must study more charts to get a feel for the probabilities better... Thanks for the explanations :)