Great Trade Set Up - Disney
Today I will share a great trade set up for a possible 10 to 12% gain in a couple months. For this set up I will take you through the entire trade and pattern and lay out the plan to trade this chart.
1 Week Chart:

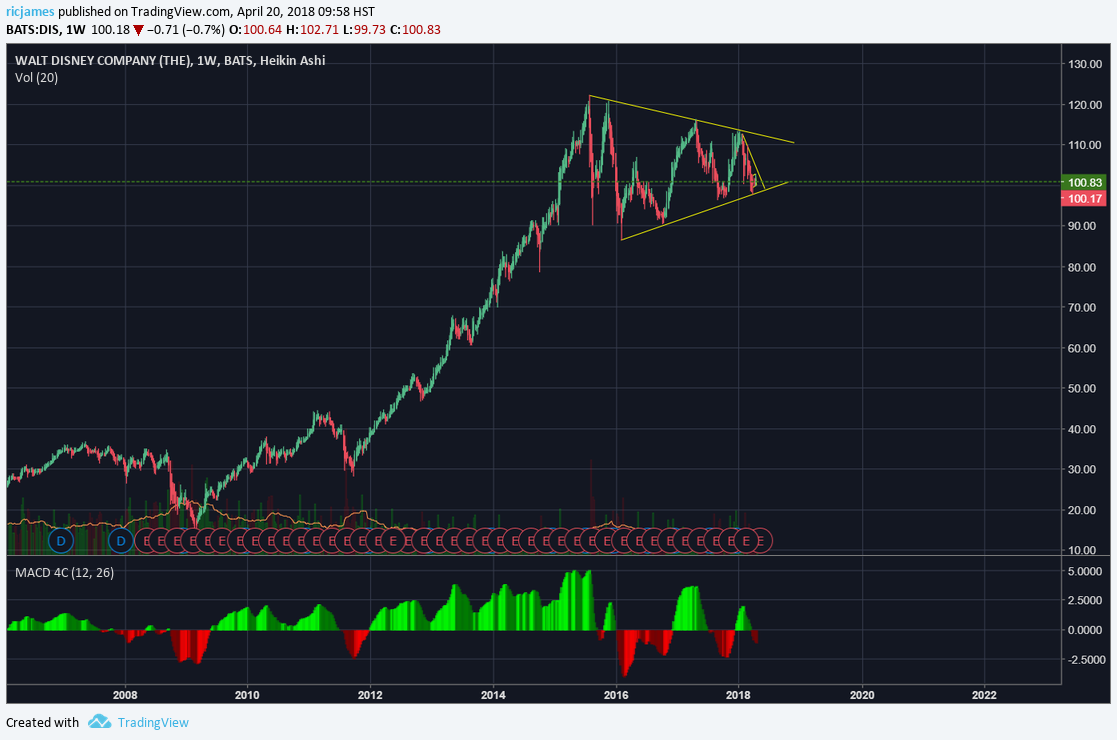
Taking a look at the chart, you can see there was a massive impulse move that has been trading within a long 2.5 year triangle. Now we know that Triangle pattern are decision points in which the chart can resolve in either direction so longterm we will have to wait and see what this pattern will do.
1 Day Chart:

Zooming in on the Triangle Pattern you can see we are touching the lower trendline right now which more times than not means that there will be a reversal to the upside. That reversal should take us all the way up until the upper trendline which would be our long-term target.
2 Hour Chart:

Zooming in a little more to find an entry point on our chart, we see that DIS is trading in a flat pattern. This pattern should resolve once again to the upside. That break should test the downward trend-line and we would either see a breakout or reversal and another downward move.
15 Min Chart:

Finally looking at the 15 minute chart of the flat pattern, we see that once again we are on the bottom of the flat and looking for upside in the short term. I would put an entry in and set the Stop-Loss to the base of the flat pattern where the lowest point of the current running flat is in case it breaks through. When you see running flats or in general patterns like this it is well worth the risk in buying the dip because 50% of the time they will reverse and give you your expected move. However, if it does break to the downside there is very little risk for this current trade.
Projection:
15 Min Chart:

So looking at my projections if you enter now you have upside on the smaller 15 minute chart to the upper resistance line, now if that breaks the resistance line that's even better for you and you continue to follow your trade with stops. If it does break to the downside you set your stop loss to the blue line or the base of the flat. This trade gives you a great 4.15 Risk to Reward ratio which is a good set up.
4 Hour Chart:

Now if that trend continues you are looking to see massive upside but I would just like to remind you to think big once again. The real trade we are going for is the month long trade that should take us to the upper resistance line of the Triangle. As you can see from this chart we are looking at 3.19 Risk to Reward Ratio with the stop being the prior moves low. Now you can play this in a lot of different ways but I would play the 15 minute chart first to limit your possible losses and if it does take you out on the 15 minute chart, I would reevaluate the trade and look for another entry point which might make the bigger trade a better R/R Ratio.
I hope you enjoyed my analysis and thoughts on this trade. If you have any questions or concerns, leave them below and I will try to get back to you in a timely manner. As always have a great day and an even better one trading!
Other Posts:
S&P500:
https://steemit.com/steem/@ricjames/weekly-update-s-and-p500