Daily Update S&P 500
This weekend I made a post about my projections for what the S&P index was going to do this week. In this post I will recap what I went over as well as share some insight into what we could see this upcoming week and how to trade it.
First of all let me share with you a chart of the S&P 500 in the Daily view.
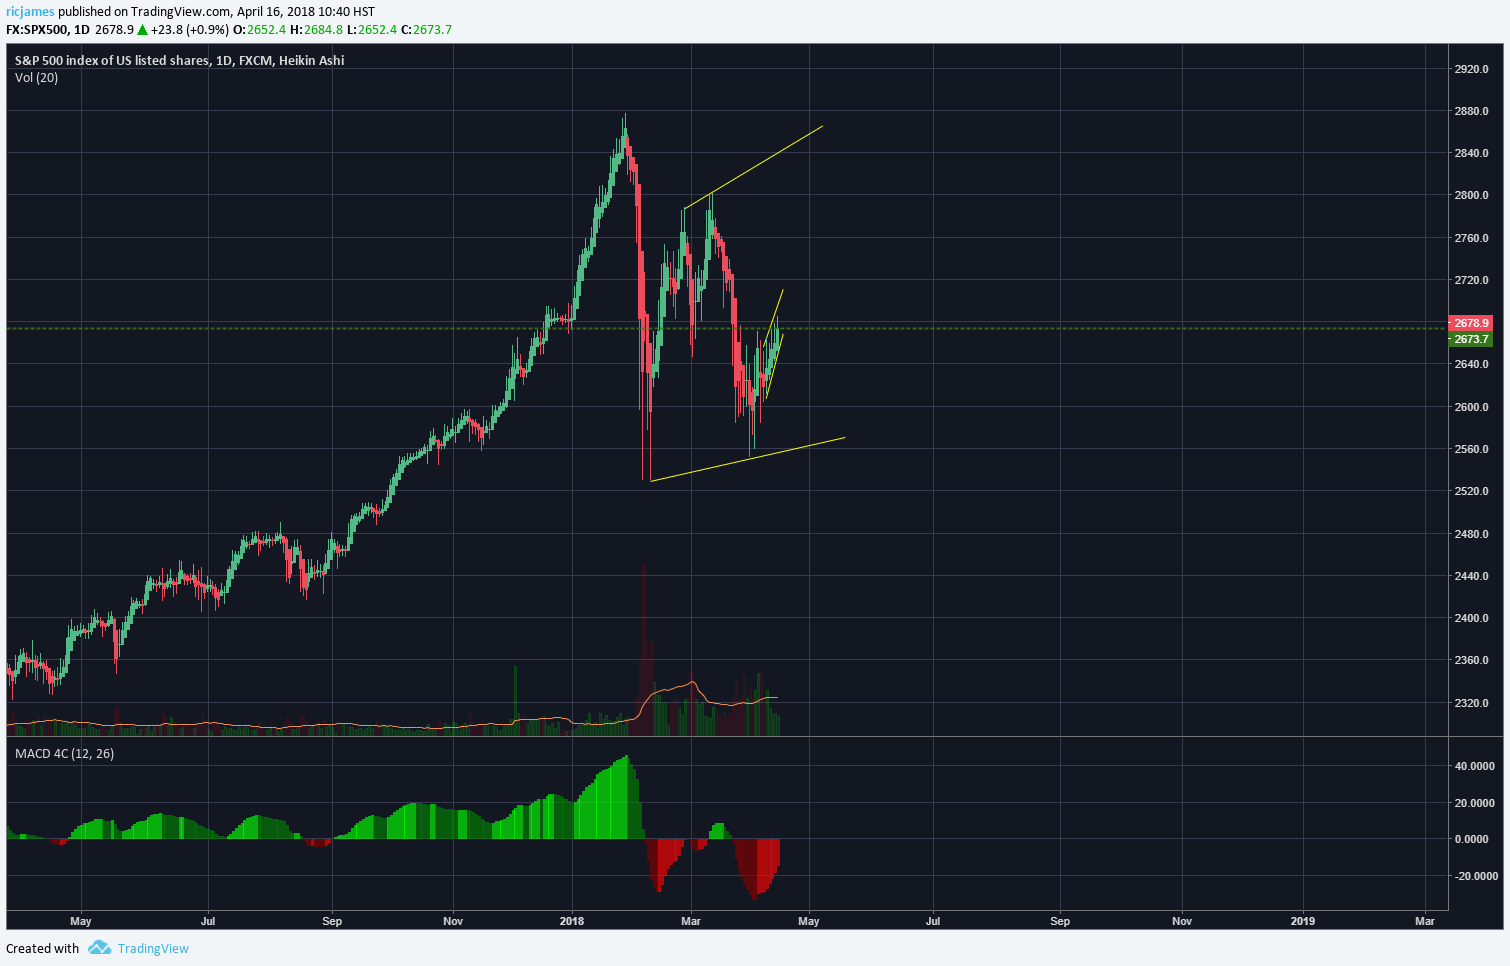
In this view you can see the overall view of the index and how the market is pushing the index up. Now I added the yellow lines because I expect to see the index to move in a flat pattern. This means that we should see the current move come up and test the upper resistance line (Shown by the top yellow line). Note that it doesn't have to touch this line as it could break through this line or come up short of it, it is there to show you the direction the chart wants to move.
Checking a smaller time frame you can see the current uptrend more clearly.
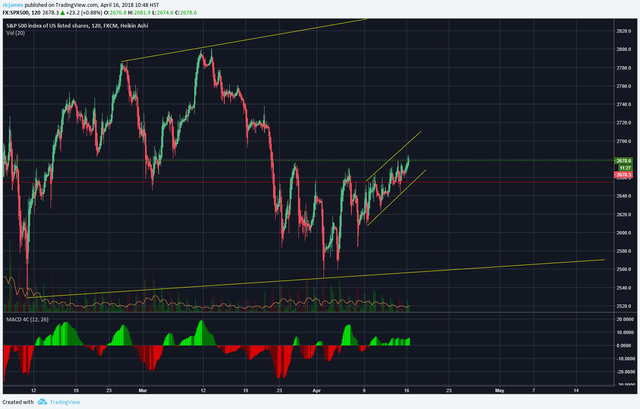
As you can see in this chart, it is moving in a very choppy slow uptrend. You can actually see that the market is trading within a small rising channel which can continue to rise for however long it wants to. However, this pattern is followed with a downward move. So I am expecting to see a drop in the market and possible test of the lower support line once more.
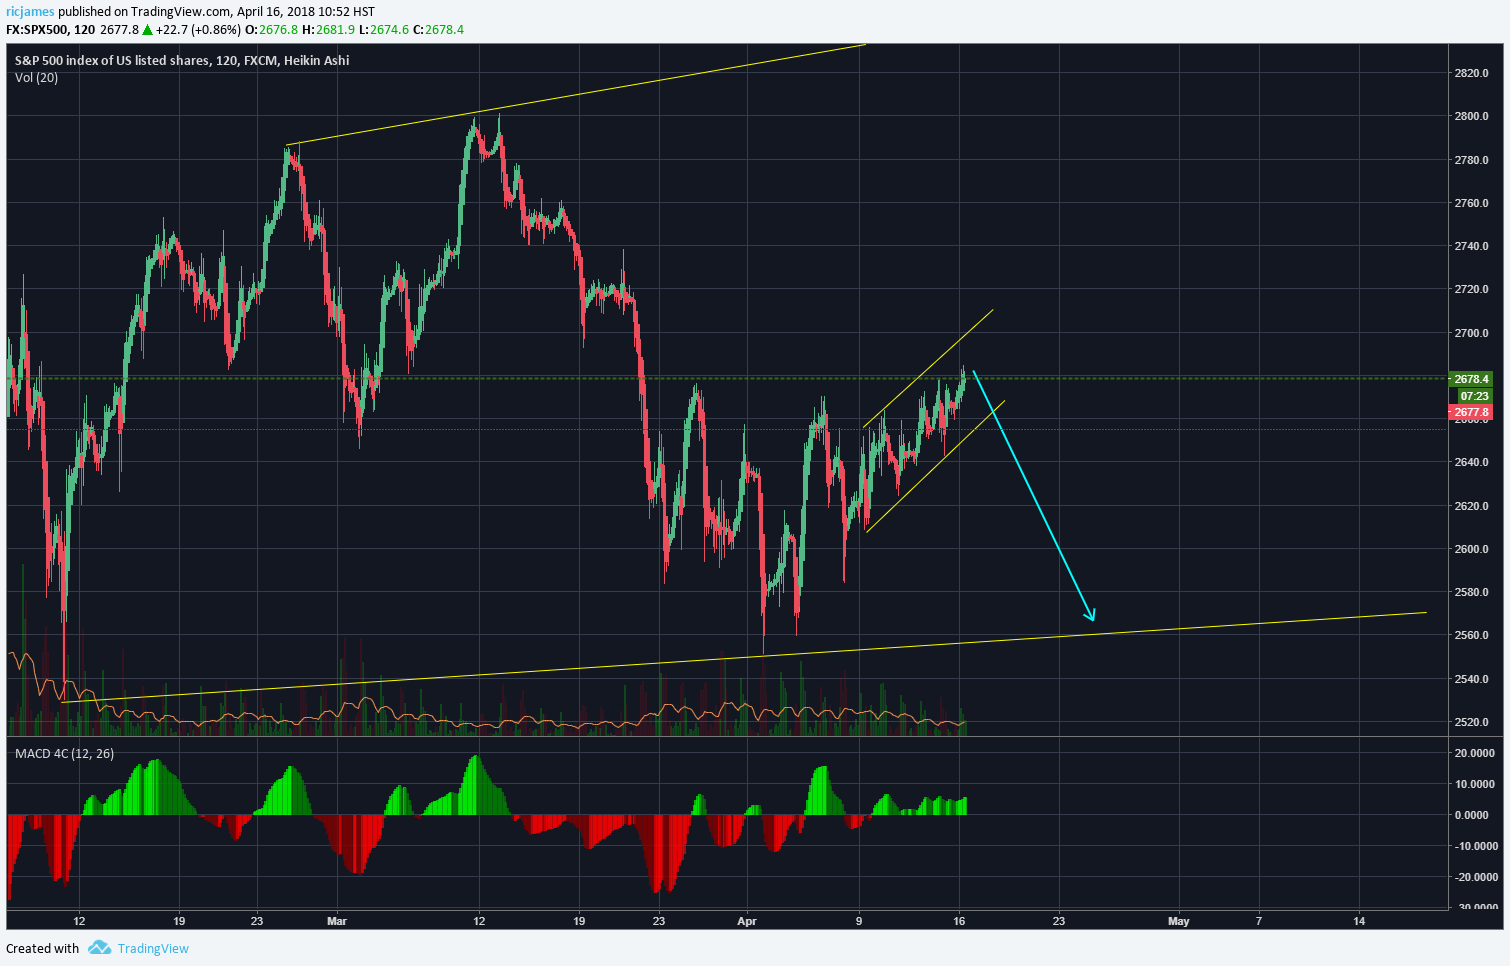
If this does occur we will be looking for another upward move that should take us to the top of the flat. Now this current move could very well continue and take us all the way to the top of the channel and we might not see the downside I am predicting so place your stops tight if you are playing this move and protect your assets.
As always have a great day and a better one trading. If you have any questions or comments leave them below and I will try to get back in a timely manner.
Previous Post:
https://steemit.com/steem/@ricjames/weekly-outlook-s-and-p-500