STEEM/BTC Teknik Analiz Güncellemesi / STEEM/BTC Technical Analysis Update [15.04.2018]
Selam arkadaşlar;
Burada yer alan bilgi, yorum ve değerlendirmeler Yatırım Danışmanlığı Kapsamında DEĞİLDİR. Yapmış olduğum analiz ve değerlendirmeler teknik verilere dayalı eğitim çalışmasıdır.
02.003.2018 tarihli günlük grafiktir / The daily chart dated 26.02.2018
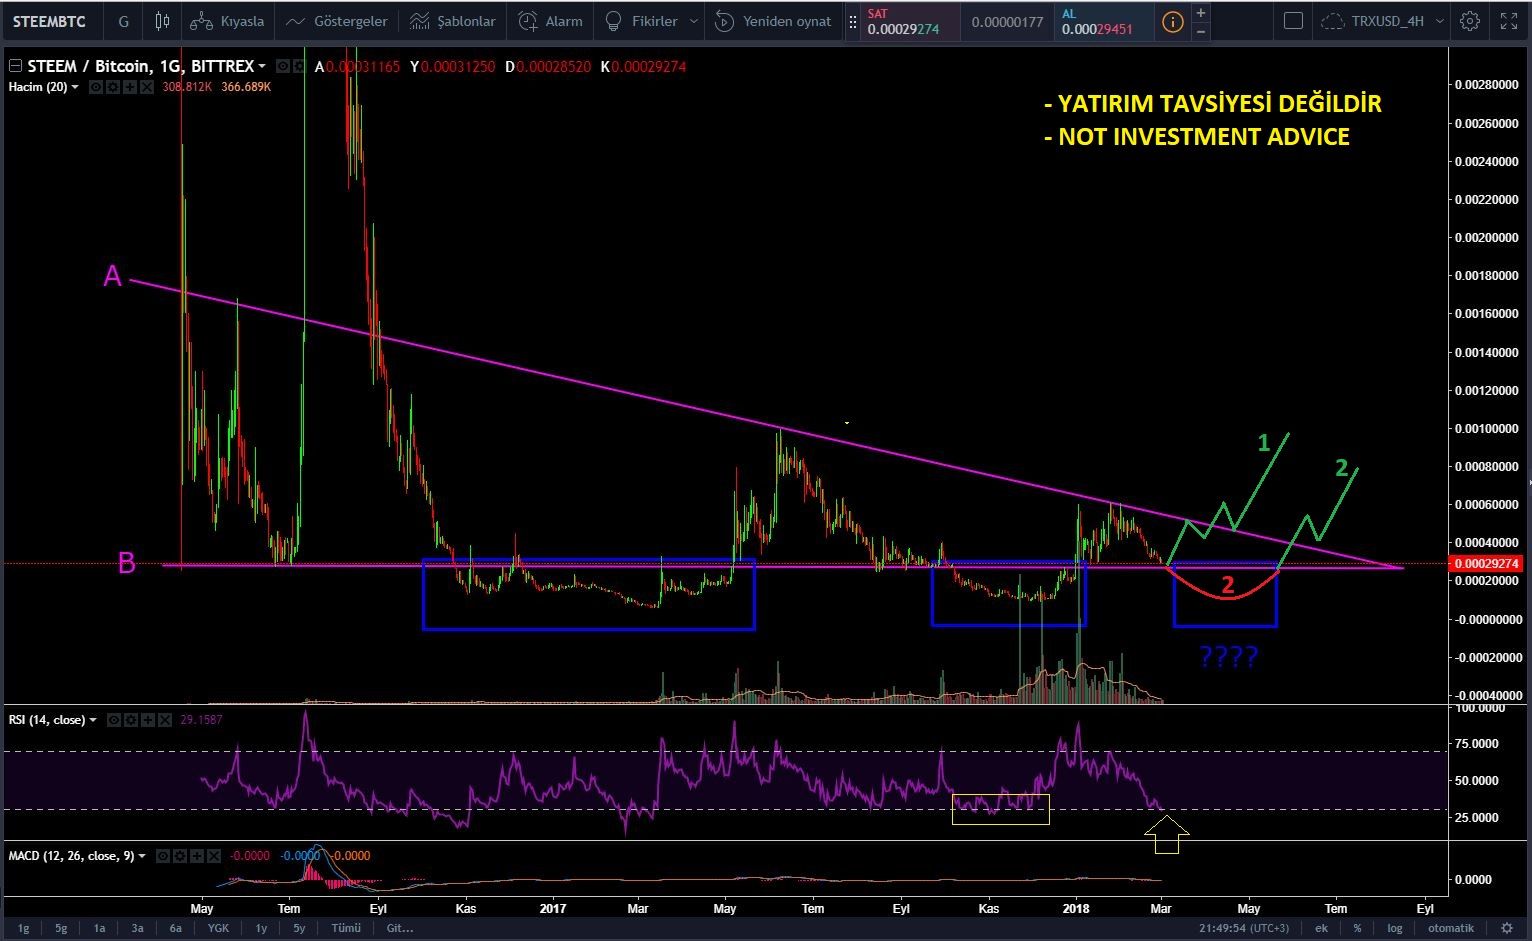
Logaritmik ölçekli günlük grafiktir / Daily chart with logarithmic scale
- Steem piyasa koşullarından dolayı önceki analizimde belirtmiş olduğum 1 numaralı yeşil yolu takip edemeyerek, 2 numaralı yola yönelmiş ve bir kısmını da tamamlamış görünmektedir.
- 2 numaralı bölgeden yükselişe geçerek B trendini yukarı kırmış müteakibinde ise A trendini yukarı kırmayı denemiş ancak başarılı olamamış.
- Hali hazırdaki durumda fiyat A trendinin altında seyretmektedir. Bu durumda B trendi destek olarak takibimizde olmalıdır.
- A trendinin hacim desteği ile kırılmasının fiyat artışına ivme kazandıracağını düşünmekteyim.
- RSI değerimiz aşırı alım (70 değeri) bölgesinden dönmüş ve yönü aşağı çevirmiş. Bu da belli bir süre olumsuz hareket gözlemleyebileceğimize işaret etmektedir.
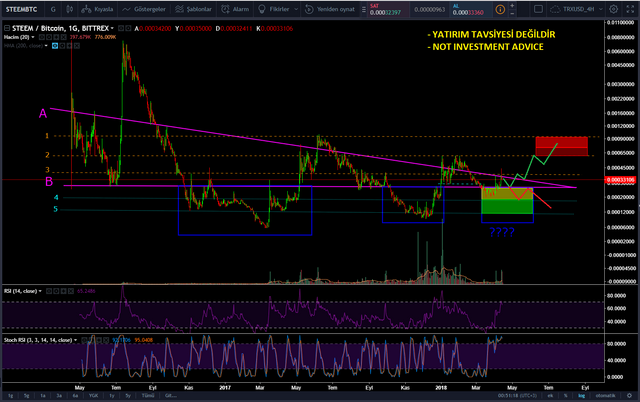
- B trendi aşağı kırılır ise 4 numaralı trend destek olarak takibimizde olmalıdır.
- Grafikte belirtmiş olduğum yeşil ve kırmızı çizgiler fiyat hareketinin izleyeceği muhtemel yolları göstermektedir (Tamamen şahsi görüşümdür. Gerçekleşmesi kesin değildir.).
Teknik analiz ile ilgili sorularınızı ve eleştirilerinizi yorum olarak yazmanız beni mutlu edecektir.

English
Hello Friends;
The informations, comments and evaluations contained herein are NOT IN Investment Advisory. The analyzes and evaluations I have made are based on technical data.
- Due to the market conditions, Steem has not been able to follow the green road number 1, which I had pointed out in my previous analysis, so it turned to road number 2 and seemed to have completed some of them.
- After breaking the B trend by going uphill from area 2, it tried to break the A trend upwards but it is not successful.
- In the present case, the price is below the A trend. In this case, we should follow B trend as a support zone.
- I think that breaking the A trend with the volume support will accelerate the price increase.
- RSI value has turned out of overbought territory (70-point) and turned downward. This indicates that we can observe negative movements for a certain period of time.
- If the B trend is broken down, the 4th trend should be in support as the support.
- The green and red lines that I have indicated on the graph indicate the possible ways in which the price movement will follow (It is completely personal, it is not certain that it will happen).
I would be happy if you write down your comments about technical analysis.
Önceki STEEM DOLAR (SBD) Teknik Analizlerim / My Previous STEEM DOLAR (SBD) Technical Analysis
1-STEEM/BTC Teknik Analizi / STEEM/BTC Technical Analysis [02.03.2018]