STEEM-BITCOIN forecast
Hello guys,
we want to share with you an original prediction on STEEM & BITCOIN.
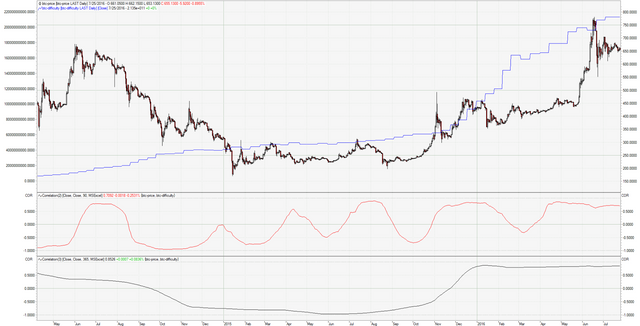
The first chart represents the bitcoin price (in USD) and the difficulty. The time frame is daily.
Under the chart you can see 2 different line:
1-Red line: it's a correlation (medium term: 90 days) between difficulty anb prices.
2-Black line: it's a correlation (long term: 365 days) between difficulty and prices.
So... From this point of view, the price is in a distribution phase... For the next future, the chance to see a new high is minimal...
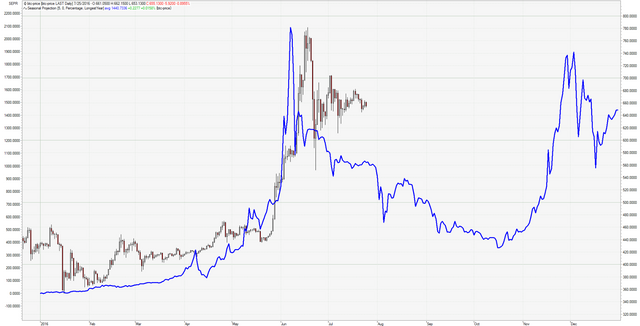
The following chart confirms the correlation analysis:
The trend forecast is bearish until october. Obviously it could be necessary to update this chart... It's only a prediction... nothing more...
And now look at STEEM.
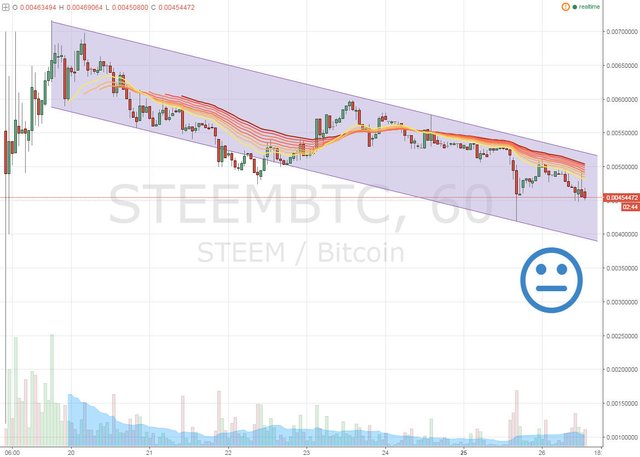
On this chart is represents the spread STEEM/BTC (time frame hourly).
The spread is in a bearish channel and the price sould collapse to 0.004 (the lower band). The bullish signal is only if moving averages cross each other and the ribbon will invert.
Have a good day & trading!
We'll update tomorrow...
P.S. Give us your feedback ;)


