You are viewing a single comment's thread from:
RE: $STEEM/BTC Daily Poloniex+Bittrex Technical Analysis Update #30 "Cause the walls start shaking" Aug 29, 2016
COMMENT
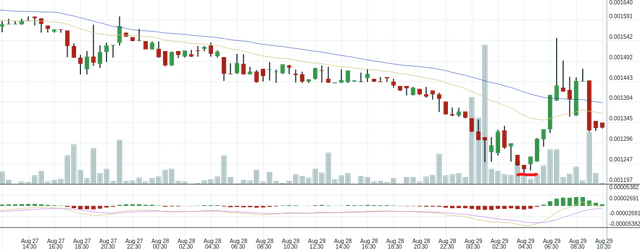
If you look at the history the downtrend moves were always mild on volume, and the bounces tended to be the ones with big volume bars, this time it is different.
The fact that we saw quite big volume on this downwards push makes me think that this MIGHT HAVE BEEN the touchdown to the bottom, the volume was big yet the price didn't dive into oblivion.
I think we might see some sideways action, will even be ballsy enough to say that I expect to see the start of the uptrend slowly showing in the course of the next few days.
There is still risk of downward potential but as you can clearly see, it is harder and harder for the bears to push the price down, thus i'd think that the downwards potential is being brought to the bare minimum.
Steem 12-Hour Arithmetic Chart:
If the current horizontal support zone fails (second orange box down), the next support zone (third down, marked with a large black arrow) looks interesting as a potential reversal zone (PRZ) - a spot that might mark a turn into a new bullish uptrend.
Lots of Confluence
If you look at the above chart you'll see an AB=CD harmonic pattern that completes its CD leg just above that horizontal support zone, as well as a bullish bat harmonic pattern that completes its CD leg. Both of these harmonic patterns are counter-trend trading patterns - they are high probability "turning points", or pivot points, in price.
The fact that they both complete within such a narrow price range, added to the fact that the next horizontal price support zone is so close by, makes the case for a lot of demand coming in around that price zone. That could be the spot where a new uptrend starts, or, at the very least, a huge upward correction is Steem's price occurs.
Steem 12-Hour Logarithmic Chart:
Price has put in a pivot low at a confluence support zone, made up of the:
1.) demand line to the price channel (bottom line of the yellow channel)
2.) horizontal price support (second orange box from the top), and
3.) 1.618 fibs extension of the first major reaction to Steem's price high.
Now price is "testing" a resistance zone (highest orange box), if you look left on the chart you'll see that price had previously put in a pivot high at that box. Because supply was there, in a strong way, in the past, there's a good chance that it will be there again. Thus, it's unwise from a technical standpoint to buy before that level is breached.
I drew in what I believe, in my experience, to be the highest probability bullish path scenario - a failure to break the resistance on the first test, followed by a correction to the lower support zone, then a demand surge that finally busts the resistance out of a double bottom pattern. I wouldn't buy until that resistance is taken out, at the very least.
As a trade, stop would go below the lower support (second orange box from the top).
What about the lower low after the big volume in the 30 min chart?
As long as the devs continue selling the @steemit's power down coin, it will probably still be in the down trend.
In this post and especially the comments the situation is explained much better:
https://steemit.com/steemit/@magnebit/steem-price-is-being-pushed-down-by-1-person-speculation-on-why-and-where-it-may-end-up
Good idea would be to monitor the powerdown by @steemit, and as soon as it stops the rally will likely happen. That is my opinion.