$STEEM/BTC Technical Analysis #2 " The only way for me to move on is to chart it in the dawn"
Hello Steemers! OZ again!
Before starting the daily blog I want to do another analysis with the same chart as in the last post, Bittrex charts again, (as I didn't save it, I reconstructed the chart to be the same as much as possible), but check out the situation that has developed just a few days later.
This post will contain a lot of pictures as I will first show the chart from the previous post followed by the developed chart showing the same area. As usual I will post the legend and do some commenting. I will again make this post in a neutral stance towards a bullish and bearish scenario, and will also explain why I do so and why every trader should also look at the charts from a neutral position, but in a later post.
Legend - old+developed charts
(LGDL)Light green dashed lines - "old" high's which should act as support
(LBDL)Light blue dashed lines - "recent" high's which should act as support
(PDL)Purple dashed lines - "recent" low's which should act as resistance
(PYL)Pointy yellow line -bottom part of recently broken triangle border
(RL)Red line - All Time High (ATH)
So, let's start!
First we have the chart showing the full Bittrex $STEEM/BTC market history.
1st old chart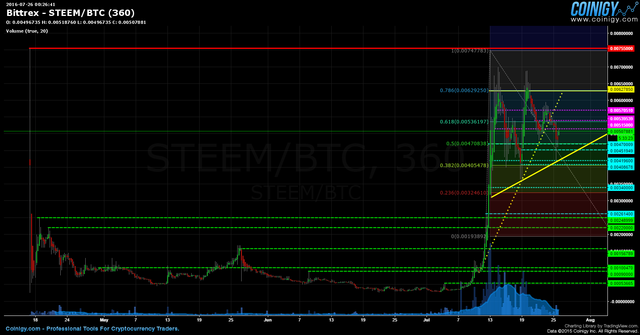
1st new chart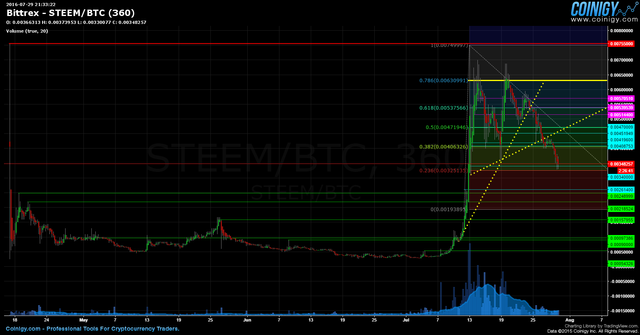
The new developed charts have no additional lines, fibs or anything else.
July 10th onward, zoomed in 6h old+ developed and the 4h ones to follow.
2nd old chart - 6h
2nd new chart -6h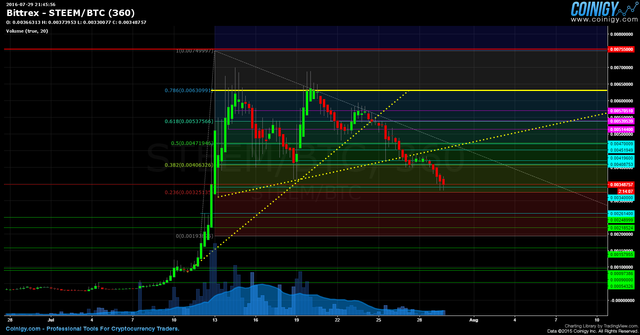
3rd old chart - 4h
3rd new chart - 4h
As mentioned in the last post, my main orientation on this chart were triangles using numerous resistance and support levels to get possible points where the trend changes along the road and reveals possible attacks on triangle borders.
On the developed, aka new charts, u can see how the price used lines of previous support/resistance to structure itself around them.
Up next are the bullish and bearish scenarios.
4th old chart - Bullish scenario
4th new chart - The bull fail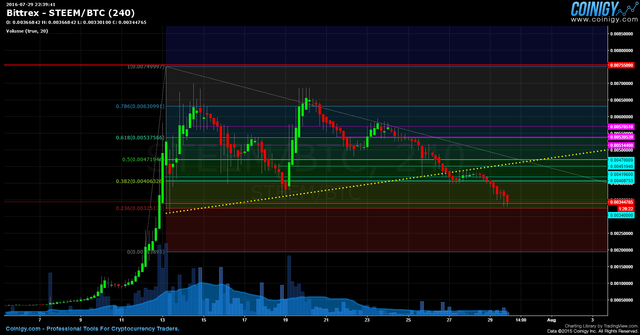
So lets see what happened here and why
Bullish fail reason chart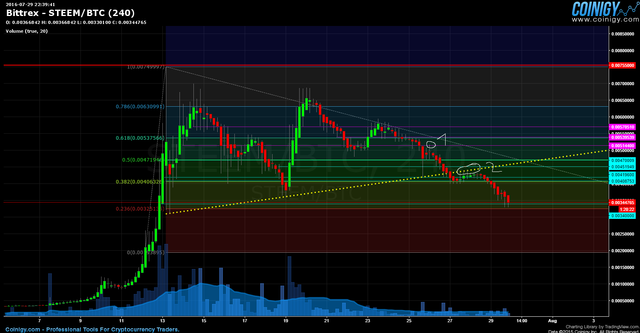
We have 2 important points
- After a hard dump, the price tried to bounce back up although with nearly no buying power/volume, hitting a strong historical resistance line and reversing back down, breaking the bottom triangle border and settling on a support line.
2.Nearly no effort was made into making the price bounce so it was easily maintained under the bottom triangle border continuing back down.
5th old chart - Bearish scenario
5th new chart - Bearish party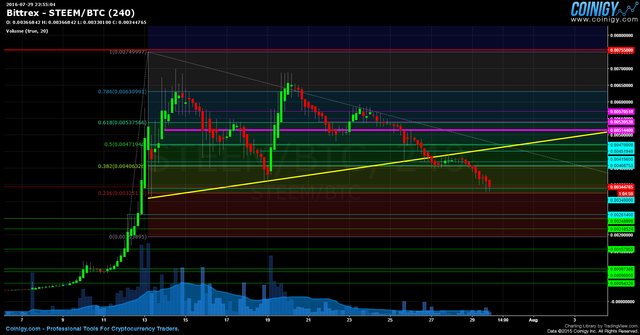
I highlighted once again the 2 lines which played the most important role into creating solid resistance and pushing the price down, breaking all the way down to the 0.0034 support level at the write time of the post.
6th old chart - bonus chart
6th new chart - bonus chart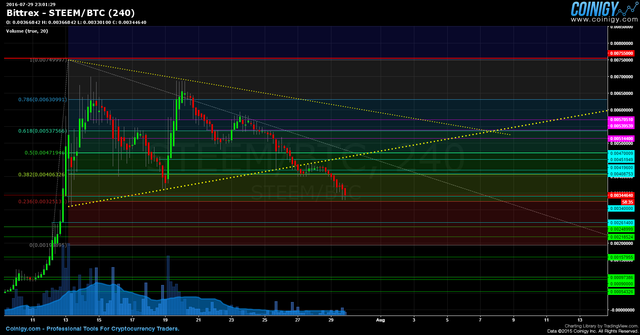
Note to self chart :P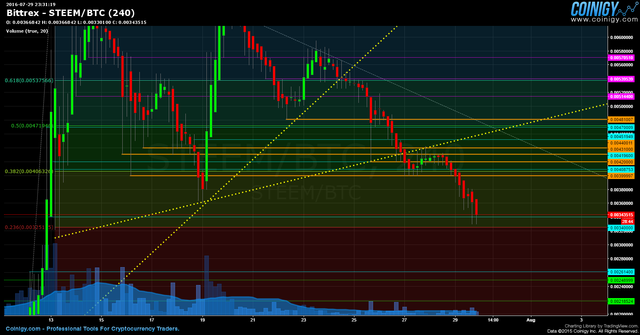
I gta chart all them lows ;)
To sum it up...
If you look at the chart at a bit more zoomed in time (July 10th onward) it looks like the price is going down to hell, but as I mentioned in the "bonus comment" from the last post, we are still in price discovery period, everything is being tested out and so is the market.
I heard a lot of panic, concern, crying, etc. in regards to the price in the time between my last post and now. All I have to say to that, is that the price took an INSANE pump, and is naturally going through it's flow. TBH the price of 1 $STEEM is still amazing, so is the chart, just look at it ;)
Idk about everyone else, but i'm looking forward to the future of STEEM!
If anyone has any questions or need's help fell free to ask, I will try to explain as fast and as best as I can.
Critics, comments, reply's, counters, advice's, etc. are always welcome!
Have my charts helped you in any way?Let me know with a comment below :)
Are there more people who are doing TA?
Disclaimer I am showing multiple scenarios on the price movement, in the post itself I do not take any stance, either bullish or bearish. I am not responsible for neither you’re winning nor you're losses upon trading!
Kind Regards, OZ :)
Good job! great charting
It's amazing how the price trends between your lines. The price is easy to follow when you present it like that. Thank you for the update OZ!
Glad my charts help you out :)
Keep following for more!
Thanks @ozchartart @ozmaster, this post looks pretty excellent, very mature analysis and hopefully accurate :)
regards:
@blackjincrypto
Thank you very much @blackjincrypto :)
look!
nice observation! let's see what will come out of it!
awesome chart @ozchartart! :) now to study them!!
Thanks @b0y2k :) enjoy :) thats always the best part!
This was definitely an extraordinary market

your post is very useful for the trade
Thank you @ozchartart
Thank you!, Glad it's of use for you :)
hi @ozmaster, upvote me please
I am also happy
Excellent, please consider making these post daily, thank you @ozchartart
Will start daily updates in the coming days ;)
Awesome, Thanks.
Great analysis. I really appreciate your effort.
Thank you very much ! keep following for more!
Keep it coming
will do :) thanks for the comment!
Awesome, thank you for the update!
Thanks! no problem, will do my best to keep it up:)
We should name you chartmaster , your analysis is truly amazing!
lel, lets not push it, I'm sure there are people whome skills are far better then mine :)
Tnx for the support :)!
cool on $3,857
upvote me please