UPDATED 12 August 2016 - Honest and explained technical analysis STEEM / BTC / USD by najoh
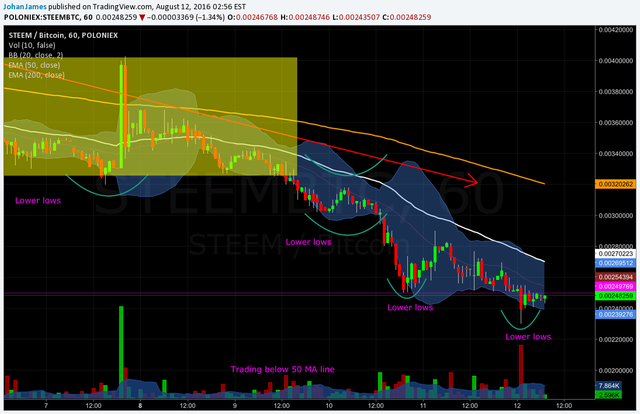
On this chart we can see that we moved outside the yellow box corresponding to the triple bottom.
Once that level broke, it was evident that STEEM would trade much lower in the following hours.
The new lower lows confirmed the bearish scenario.
We are still trading under the 50 and 200 MA. A small dead cat bounce occured after the sell off that followed the downside breakout.
The chart is still very bearish until the price can go over the 50 MA line (white line). For now i would advise anyone to stay on the sidelines until a bullish sign appears.
Please, do not forget that anything can happen at any time, there is no sure science in trading.
Volume
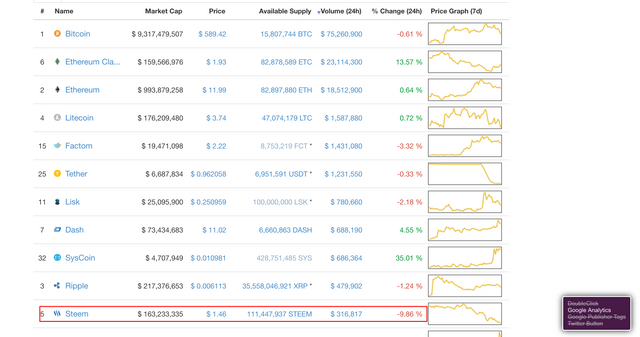
The trading volume of STEEM still very low compared to the other cryptocurrencies.
HELP on how to understand the charts
Under this line I explain how to understand the charts, I will use this information from now on to help you guys to understand better how this whole thing works.
What is the 50 MA and 200 MA and why does it matter ?
Link : http://www.investopedia.com/terms/m/movingaverage.asp
When the price is trading under the 50 MA is a bearish sign, meaning that the price should be moving lower in the future. The same goes for the 200 MA, but the 200 MA is a longer term trend, trading under the 200 MA is very bearish.
Where are we now ? We are trading under the 50 MA and 200 MA. Bearish.
Bullish reversal, how to see it
You may want to know when the price is going to reverse, first of all the price should move over the 50 MA, then the 200 MA, once it's there, the 50 MA line should cross over the 200 MA line, if this doesn't happen, it's a bearish sign, if this does happen, it's a bullish sign.
If you see the white line (50 MA) crossing over the orange line (200 MA), this will mean that the price of STEEM is going to go much higher and that the longer trend reversed from bearish to bullish.
Actually the white line (50 MA) is trading under the orange line (200 MA), this is a very bearish sign, meaning the price is most likely to go down. On the chart you can see that sometimes the price go over the orange line (200 MA), you may think that it's a bullish sign, but it's not. It's what we call a dead cat bounce* and it's a good point to sell off your STEEM if you still have any.
Dead cat bounce
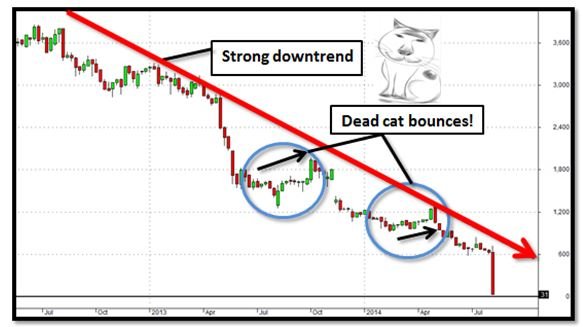
A dead cat bounce is when the price rebounds after a fall and then falls back again. This is what happened on the STEEM chart when the price moved over the 200 MA for one hour.
Lower lows, what it is

Lower lows indicate that the trend is bearish and prices going down more and more, until a higher low happen, we can expect the prices to go down. If you look at the chart, we have only lower lows, meaning the odds of the price going higher are very unlikely. Once we start seeing higher lows, the trend could reverse.
Support and resistance points

The support is where the price in the past encountered a lot of buyers and where the price couldn't go lower. If a support is broken, we look for the next support and so on. Breaking a support one after another is a very bearish sign.
The resistance is where the price in the past encountered a lot of sellers and where the price couldn't go higher. If a resistance is broken the price might go much higher in the near future, it's a very bullish sign.
Parabolic move

When the price rise higher very fast this creates a parabolic move, when this happens almost always the price falls back to where it was before the move occured. You should sell at the top of the parabolic move and wait for the price to cool down.
Triple bottom

Normally a triple bottom is a bullish sign. In our chart our triple bottom went down instead of going up. This is very bearish. When that happen the price will trade much lower, it's exactly what happened.
Hi najoh, great post! Very informative and I love the explanations it makes it so much easier to see whats going on when someone explains it to you in a way that even a lowly Forklift driver like myself can understand.
Thanks for sharing your experience!
Great very good very detailed and clear explanation. Congratulations. It's is my first post into steemit