Technical analysis STEEM 06 August 2016

https://www.tradingview.com/x/ul3bDZyj/
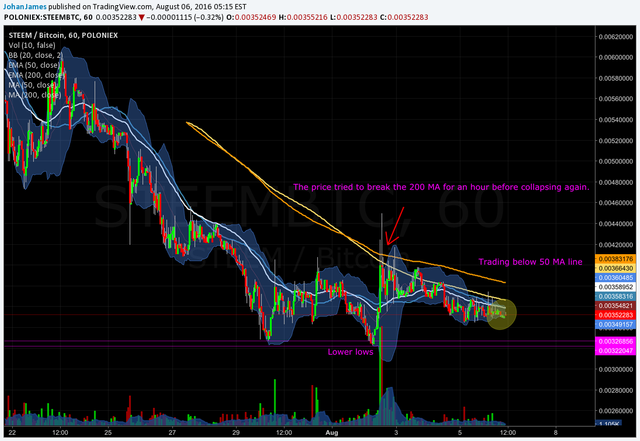
We can expect the price to go lower in the next trading sessions, if we break the 2 USD support level we might see the price go back to 25 cts where it was before the parabolic move that occured when the platform took off. This is a normal consolidation movement after a big move.
We can see in the chart that the price tried to move over the 200 MA line with a lot of buyers, but it was quickly followed by a sell off.
We are now trading under the 50 MA line, this is a bearish sign, we can expect prices to move lower.
RSI is at 45, is not high nor low, the price could go in either direction but i personally believe that the price will move lower because of the selling pressure.
Thanks for the news
There are other posts about technical analysis but too much information kills the information, those posts have too many screenshots and it becomes difficult to understand what is going on. My analysis is very short but it's a proven strategy that works using technical analysis systems that are used by JP Morgan and GS.
@najoh Looks like those Bollinger Bands are squeezing!!