How can this price possibly hold? 🌀
I've never seen a chart look like this before. I must be missing some relevant external data which would explain this to my ignorant investor mind.
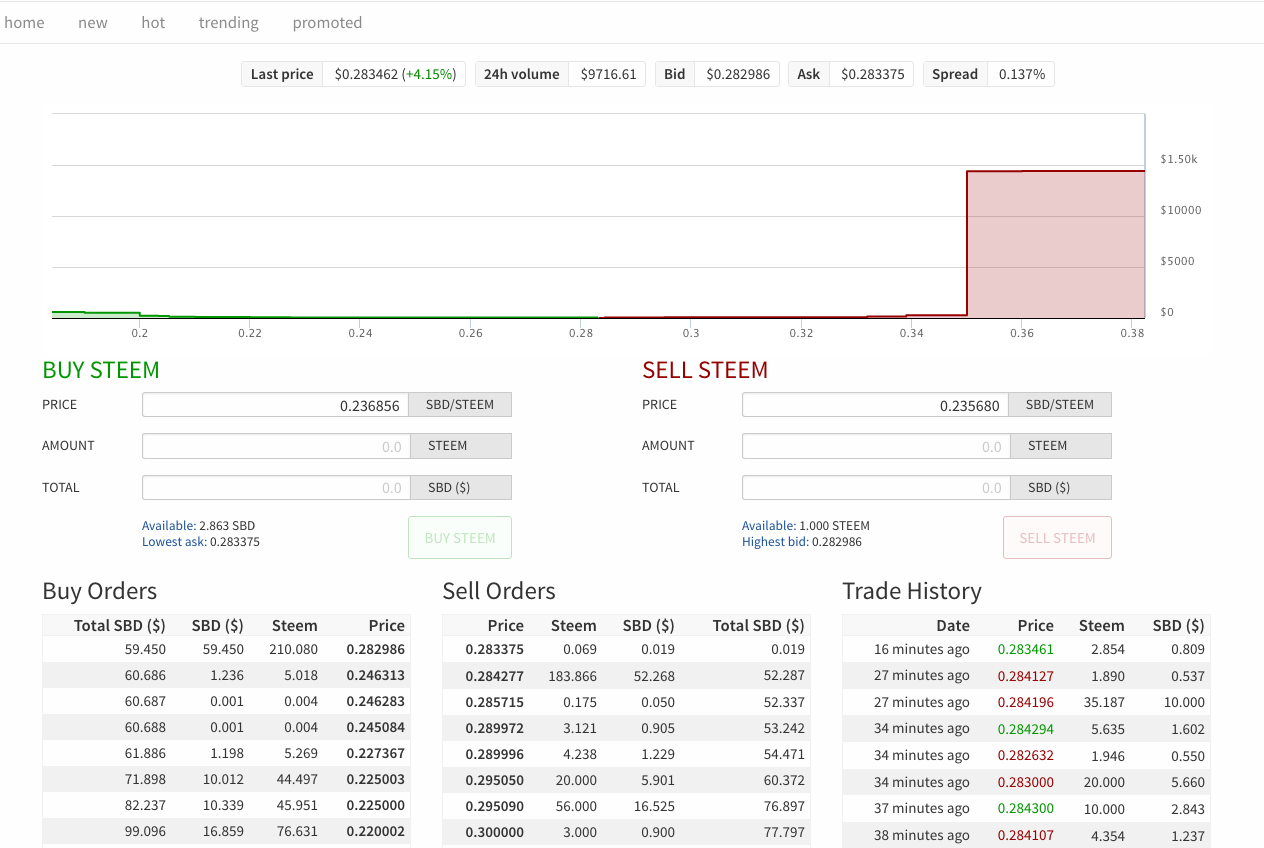
Anyone have any explanations? Is it that there is just too little volume/few trades on the internal market?
Thanks For Your Attention and Support!
Melech ben Chaya מלך בן חיה, @inphiknit

Seen the same few hours ago but the pattern change quite a few times in the last few hours. Don't know what to make of it but the trend seems up which i guess we should be happy about.
I think I need 1 to 1 lessons with a trader for a good few hours, lol! Cause I don't know what to make of these charts either...!
These chart are not very good to spot anything because it's not having the good information for technical charts.
I think I see that now. The advanced charts are why I need a tutor if I am going to get serious about it!
I dnt knw but STEEM is $0.51 on CoinMarketCap :0
$.28@Steemit ;)
That's 0.51 USD per STEEM on Coinmarket, and 0.28 SBD per STEEM though right?
@inphiknit
No, it was $.028cents per STEEM when I had wrote but now @steemit rate is $0.30 You will see different rates on different exchanges thus giving an arbitrage opportunity, profiting off the difference ;)
But obviously we can't buy 0ff of Coinmarketcap but this can lead us to knowing where price is headed ;)
I appreciate your sharing of your wisdom :)
This post has been ranked within the top 50 most undervalued posts in the first half of May 07. We estimate that this post is undervalued by $5.71 as compared to a scenario in which every voter had an equal say.
See the full rankings and details in The Daily Tribune: May 07 - Part I. You can also read about some of our methodology, data analysis and technical details in our initial post.
If you are the author and would prefer not to receive these comments, simply reply "Stop" to this comment.
Made a call and must go out for a couple hours. So thanks in advance to anyone who answers.
:)